

- Signal Fidelity - Choose the correct sample rate vs waveform characteristics
watch webinar
Q1: Is 12 dB the theoretical maximum for Peak to Average Ratio?
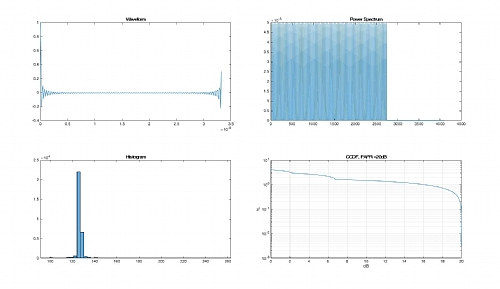
A1: 12 dB is a pretty high PAPR value. However, it is not extraordinary and not a limit for this parameter. Theoretically, the PAPR value is unbounded, so there is no limit for it other than the physical limitations of baseband processors, modulators and, especially, amplifiers. As an example of this, the PAPR of a multi-tone signal with a constant phase distribution is equal 10xlog10(N), where N is the number of tones. So, for a 100 tones, we get 20 dB as you can see in this simulation:
For a 1000 tones signal, we get 30dBs:
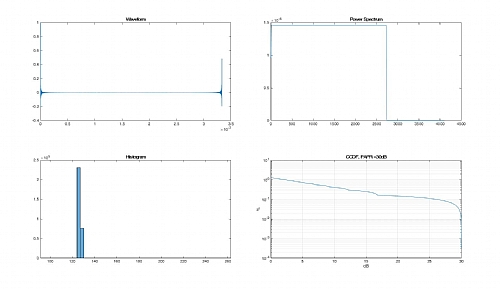
And so on.
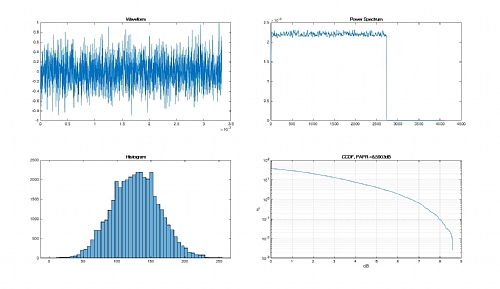
However, it is true that many OFDM signals with hundreds or thousands of modulated carriers (with uncorrelated data) tend to show PAPR values around in the 8 to 15dBs range. The previous multi-tone signal with a random phase distribution is a good example:
Sometimes, the worst case PAPR is very influenced by the behavior of specific channels or training symbols carrying some especially damaging information resulting in a very high peak-power.
****
Q2: what does CCDF STANDS FOR?
A: CCDF stand s for Complementary Cumulative Distribution Function. This is a standard statistical analysis for the distribution of a variable. In this case, the variable analyzed is the instantaneous power relative to the average power (so the 0dB level corresponds to the average power). In communication systems, the probability of experiencing a transmission error is everything. As some errors can be caused by non-linearity behavior (especially compression and clipping), the probability of finding the signal over a given power level is a very important piece of information to optimize the transmission system and this is exactly what the CCDF shows. Additionally, it gives immediate information about improvements when transmitted power is changed or the amplifier settings (i.e. Operating Voltage) are changed.
****
What will be good PAPR for Manpack radios > and also for 5 G handset?
A2: This is a very difficult question to answer as it depends on many factors. Generally speaking, modulated signals have a given ideal PAPR. The other issue is how these modulation schemes cope with non-linearities, especially clipping. Some single carrier modulation formats are very resilient to clipping (i.e. BPSK, QPSK, FSK) while they show a very low ideal crest factor. Others are quite sensitive (256 QAM, 1024QAM). OFDM signals may show PAPR in the 8-15dB range and the sensitivity to clipping varies depending of the channel coding and error protection schemes applied. Manpack radios may use a large variety (sometimes in the same device) of modulation formats. For 5G networks, there is an important difference with LTE, where the up-link modulation scheme (SC-FDMA) was designed for a low PAPR as battery life was an important consideration for mobile terminals (as handsets). Most of 5G standards seems to use the same modulation scheme in the up-link and the downlink, although it looks like there will be the possibility of using SC-FDMA to either increase the average power or battery life. Many 5G signals show PAPR in the 12 to 15dBs range. SC-FDMA can reduce PAPR by more than 3 dBs without clipping. The level of clipping always depend on the robustness of the modulation scheme AND the channel coding (including error protection).
****
Q3: Is 12 dB the theoretical maximum for Peak to Average Ratio?
A3: 12 dB is a pretty high PAPR value. However, it is not extraordinary and not a limit for this parameter. Theoretically, the PAPR value is unbounded, so there is no limit for it other than the physical limitations of baseband processors, modulators and, especially, amplifiers. As an example of this, the PAPR of a multi-tone signal with a constant phase distribution is equal 10xlog10(N), where N is the number of tones. So for a 100 tones, we get 20 dB as you can see in this simulation:
****
Q4: Are the ‘burst pulse like’ signals in the display, the spectrum of the signal?
A4: I believe that you are talking about some displays showing the instantaneous power vs. time displays. These displays show the evolution of the power of the modulated signal as function of time and it is the raw data used to calculate the average power, the peak power, the crest factor or PAPR, and the CCDF analysis. Many RF signals, especially those used by wireless networks, consists in RF bursts, often of different duration. Power analysis must be done basically in the “live” portion of the bursts and not in the silent periods between bursts so looking at the behavior of the instantaneous RF power over time is important. Additionally, spectrum is not directly measured by Power Meters. You need a spectrum analyzer to get the spectrum.
****
Q5: Is crest factor of 0.01% sufficient for design amplifier or should we consider peak to average power for design?
A5: Crest Factor and PAPR (Peak-to-Average-Power-Ratio) are basically the same measurement. Typically, percentage levels are used as the Y axis dependent variable in a CCDF plot, where the independent value is the power level relative to the average power. Using the CCDF you can establish how much time (as a percentage of the total) the signal spends over a particular power level. In a real situation, the 1-dB compression of the saturation level for the amplifier could be applied to the CCDF function to know how much time the signal is transmitted under compression or clipping conditions. Depending on the statistics of the clipping, the transmitted power, and the channel coding robustness, this level of errors may be acceptable or not. This is why testing receivers, with realistic signals with controlled impairments, are so important. The CCDF measurement provides a good statistical analysis of the probability of exceeding some power level. The probability of clipping should be low enough so the “quasi-error-free” transmission conditions are kept. In other words, the acceptable percentage of time the signal can spend in the non-linear regions of the amplifier, depends on the integrity of the received payload.
****
Q6: How many dB reduction in PAPR of the input is a good number? Is 3-4dB good?
A6: Indeed, 3-4dB is a good PAPR reduction. However, reducing PAPR is relatively simple through methods such as the popular “clip and filter”. The real problem is how this reduction impacts the quality of the transmission. When the signal is clipped, the modulation accuracy suffers (EVM is worse for the clipped symbols) and eventually there will be errors resulting from the degradation of the modulation quality. Depending on the statistics of the clipping, the transmitted power, and the channel coding robustness, this level of errors may be acceptable or not. This is why testing receivers with realistic signals with controlled impairments are so important. The CCDF measurement provides a good statistical analysis of the probability of exceeding some power level. The probability of clipping should be low enough so the “quasi-error-free” transmission conditions are kept. In other words, how good the PAPR improvement can be depends on the integrity of the received payload.