
Introduction
This white paper introduces the Effective Number of Bits (ENoB) concept and its impact on the real performance of AWGs in different applications. The ENoB specification is made of multiple parameters and the importance of each greatly depends on the signal being generated and the way it will be applied to the system under test.
The high-performance Tabor Proteus series of AWGs have been designed for high quality baseband and RF signal generation at frequencies up to 9 GHz. ENoB performance is an important component of this accomplishment. However, only the ENoB specification by itself cannot deliver the signal quality some applications require. This paper will deal with all aspects of linear and non-linear distortions and how they contribute to the overall performance, including ENoB, of an AWG such as the Proteus series from Tabor Electronics.
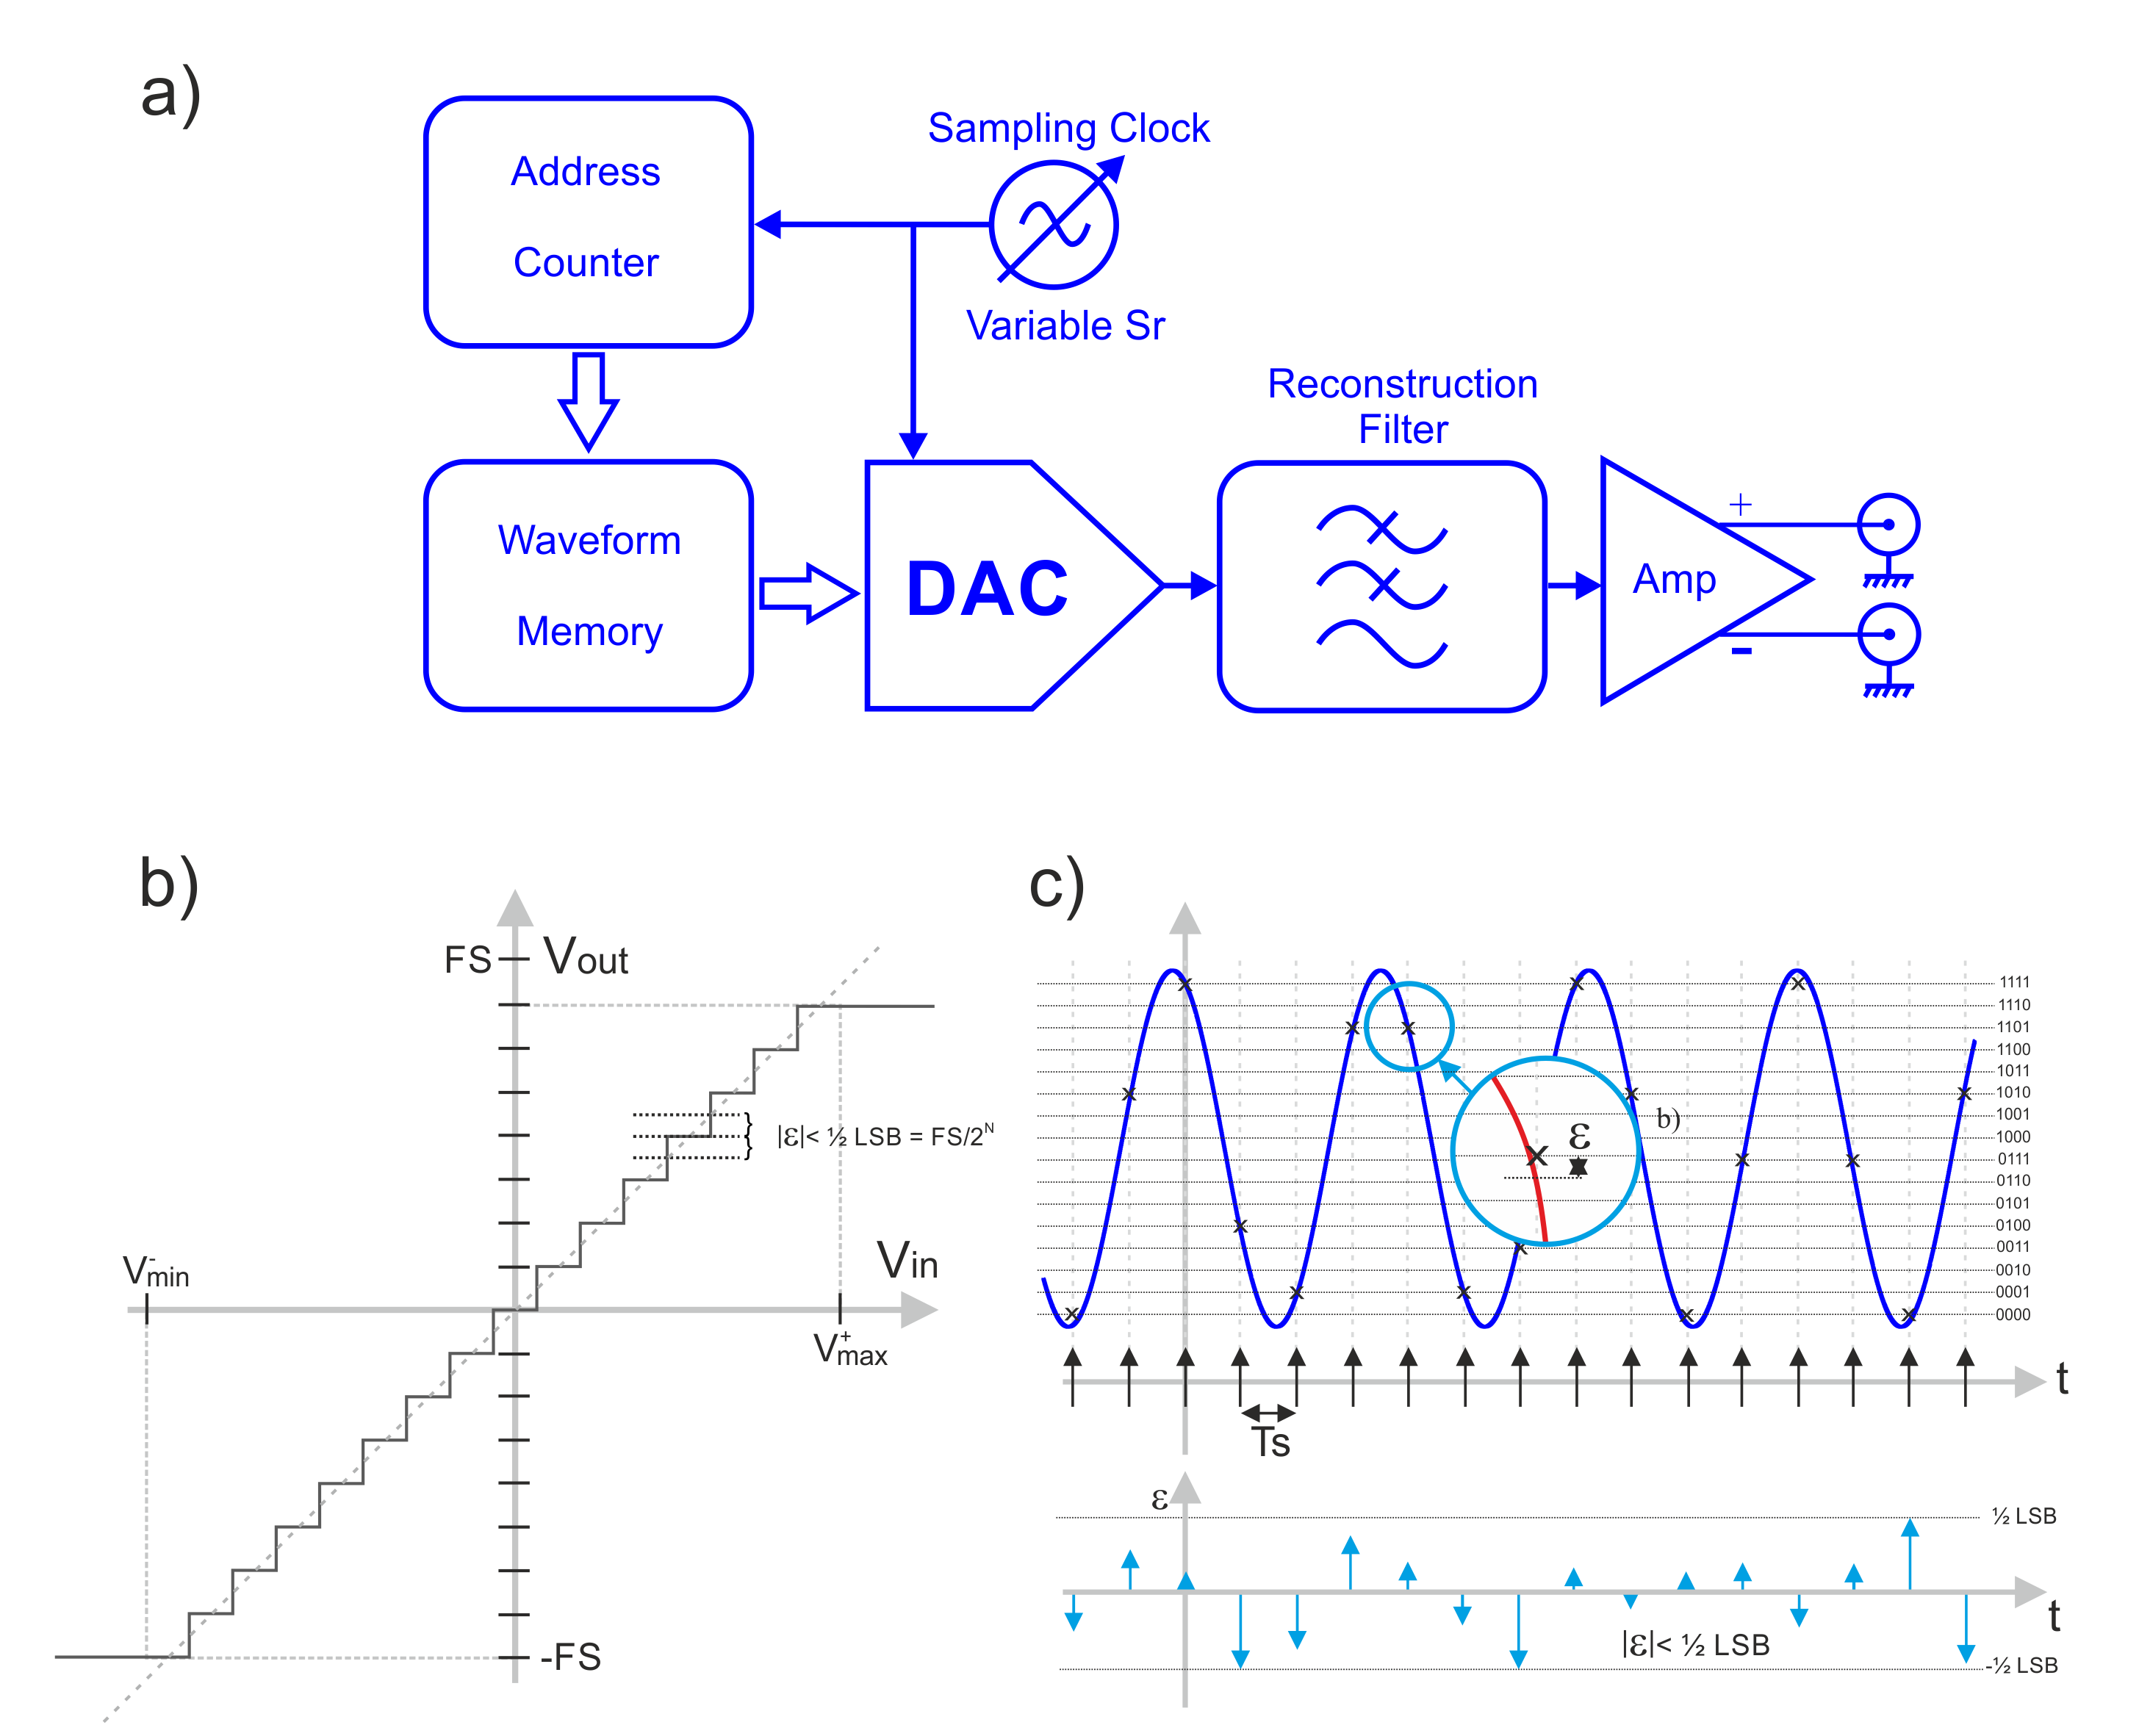
Figure 0.1 Tabor Electronics 9 GS/s Twelve Channel RF Arbitrary Waveform Generator P94812B
1 Effective Number of Bits (ENoB)
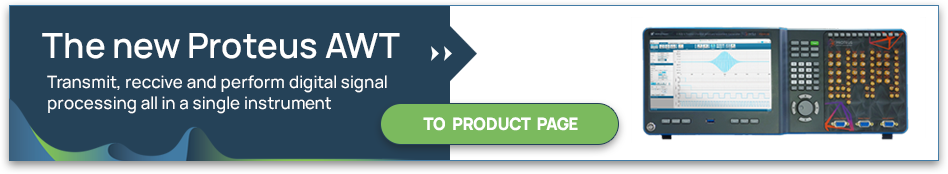
Arbitrary Waveform Generators (AWGs) convert a series of mathematically derived values (or samples) into a real analog signal. The signal samples are stored in the AWG’s memory and are “played out” through the instrument’s Digital-to-Analog Converter (DAC), at a rate defined by the instruments sample clock and a resolution equal to the number of bits the DAC has, see Figure 1.1, a), page 3. Already we can see that the waveforms will not be a perfect replica of their ideal analog counterparts, even if their mathematical definition is perfectly accurate. Each time-domain value is quantized, i.e., corresponds to a specific instance in time of a value defined by the sample clock or sample rate and DAC resolution. Therefore, not all continuous instantaneous levels of the signal are generated. The sampling rate defines the maximum frequency that can be generated by the instrument. This is defined by the Nyquist Sampling Theorem and it states the condition a given signal must meet to be reproduced without any loss of information. The theorem states that the highest component of the signal in the frequency domain must be strictly located below half of the sampling rate.
Figure 1.1 “True Arb” architecture AWGs (a) produce quantization noise because of the limited resolution of the DAC (Digital-to-Analog Converter) as seen in b). Quantization noise is random and wideband while the peak-to-peak amplitude is limited (c).
We also have quantization in the amplitude dimension, defined by the bit resolution of the DAC. Real-world DACs convert binary integers of a finite length (called resolution) to a given number of discrete integer levels, 2N for a length of N bits, see Figure 1.1 b). Many modern DACs have excellent linearity across their range so the quantization level, or the distance between two consecutive levels, is the same throughout the full range of the part. Usually, the higher performance the DAC is, the better resolution is specified. However even high-performance DACs will still produce inaccurate waveforms as any level must be rounded to the nearest discrete integer level as discussed earlier. The error can be analyzed as a quantization noise signal added to the perfect signal, see Figure 1.1 c) . The peak-to-peak amplitude of this noise is equal to Q = 2A/2N (quantization level) and it is uniformly distributed over its full range. One way to characterize statistically the impact of finite sample resolution is by calculating the SNR (Signal-to-Noise ratio). For a simple signal such as a sinewave using the full DAC range:
S(t) = A * sin(2*π*fc*t); (1)
Q = 2A/2N (2)
S’(nT) = Q x round((A + Q/2) * sin(2* π *fc*nT) / Q) (3)
For N>>1
S’(nT) = Q x round(A * sin(2* π *fc*nT) / Q) (4)
SNRQ(dB) = 6.02 *N + 1.76 (5)
The above shows that the signal to quantization noise ratio improves by 6.02 dB for each additional resolution bit in the DAC. So, at least theoretically, the higher the resolution, the better signal fidelity. However, this assumes we have an ideal DAC.
Unfortunately, real world is not ideal at all. There are many linear and non-linear factors influencing the accuracy of any waveform being generated by an AWG. Even an ideal DAC in an AWG would incorporate thermal noise (unless it works at absolute zero temperature). A typical lab temperature is 25oC, therefore the thermal noise power density is -174 dBm/Hz. For the previously described sinewave being generated over a 50W load, the SNR for this thermal noise will be:
S(t) = A * sin(2*p*fc*t); (6)
PS(dBm) = 10 log10(A2/(2*50)) + 30; (7)
PN(dBm) = -174dBm + 10.0 x log10(BW (Hz)) = -174dBm + 10.0 x log10(SR / 2); (8)
SNRT(dB) = PS(dBm) - PN(dBm); (9)
An interesting exercise is applying the above expressions to a real case. For an SR = 9GSa/s AWG generating a 1Vpp (A = 0.5) sinewave, the signal to ideal thermal noise ratio would be:
PS(dBm) = 3.98dBm
PN(dBm) = -77.47dBm
SNR(dB) = 81.45dB
The above noise is Gaussian and not uniformly distributed as quantization noise. However, it is possible to define the resolution of an ideal DAC whose quantization noise is equal to the thermal noise for the Nyquist BW, in the above example:
6.02 x NE + 1.76 = SNR
NE = (SNR - 1.76) / 6.02 (10)
For the previous example, the above expression results in:
6.02 x NE + 1.76 = 81.45
NE = (81.45 - 1.76) / 6.02 = 13.24 bits
The NE parameter is the equivalent number of bits and it basically expresses the maximum ideal resolution that can be implemented for a given sampling rate. In this case, beyond 14 bits of resolution the ideal quantization noise would be lower than thermal noise so there would not be any real advantage in increasing the resolution of the DAC, refer to Figure 1.2. In fact, given the Gaussian distribution of thermal noise, the peak-to-peak amplitude of quantization noise will be like that of thermal noise at a much lower resolution, or 11/12 bits. The equivalent number of bits decreases with sampling rate as thermal noise power is proportional to the bandwidth.
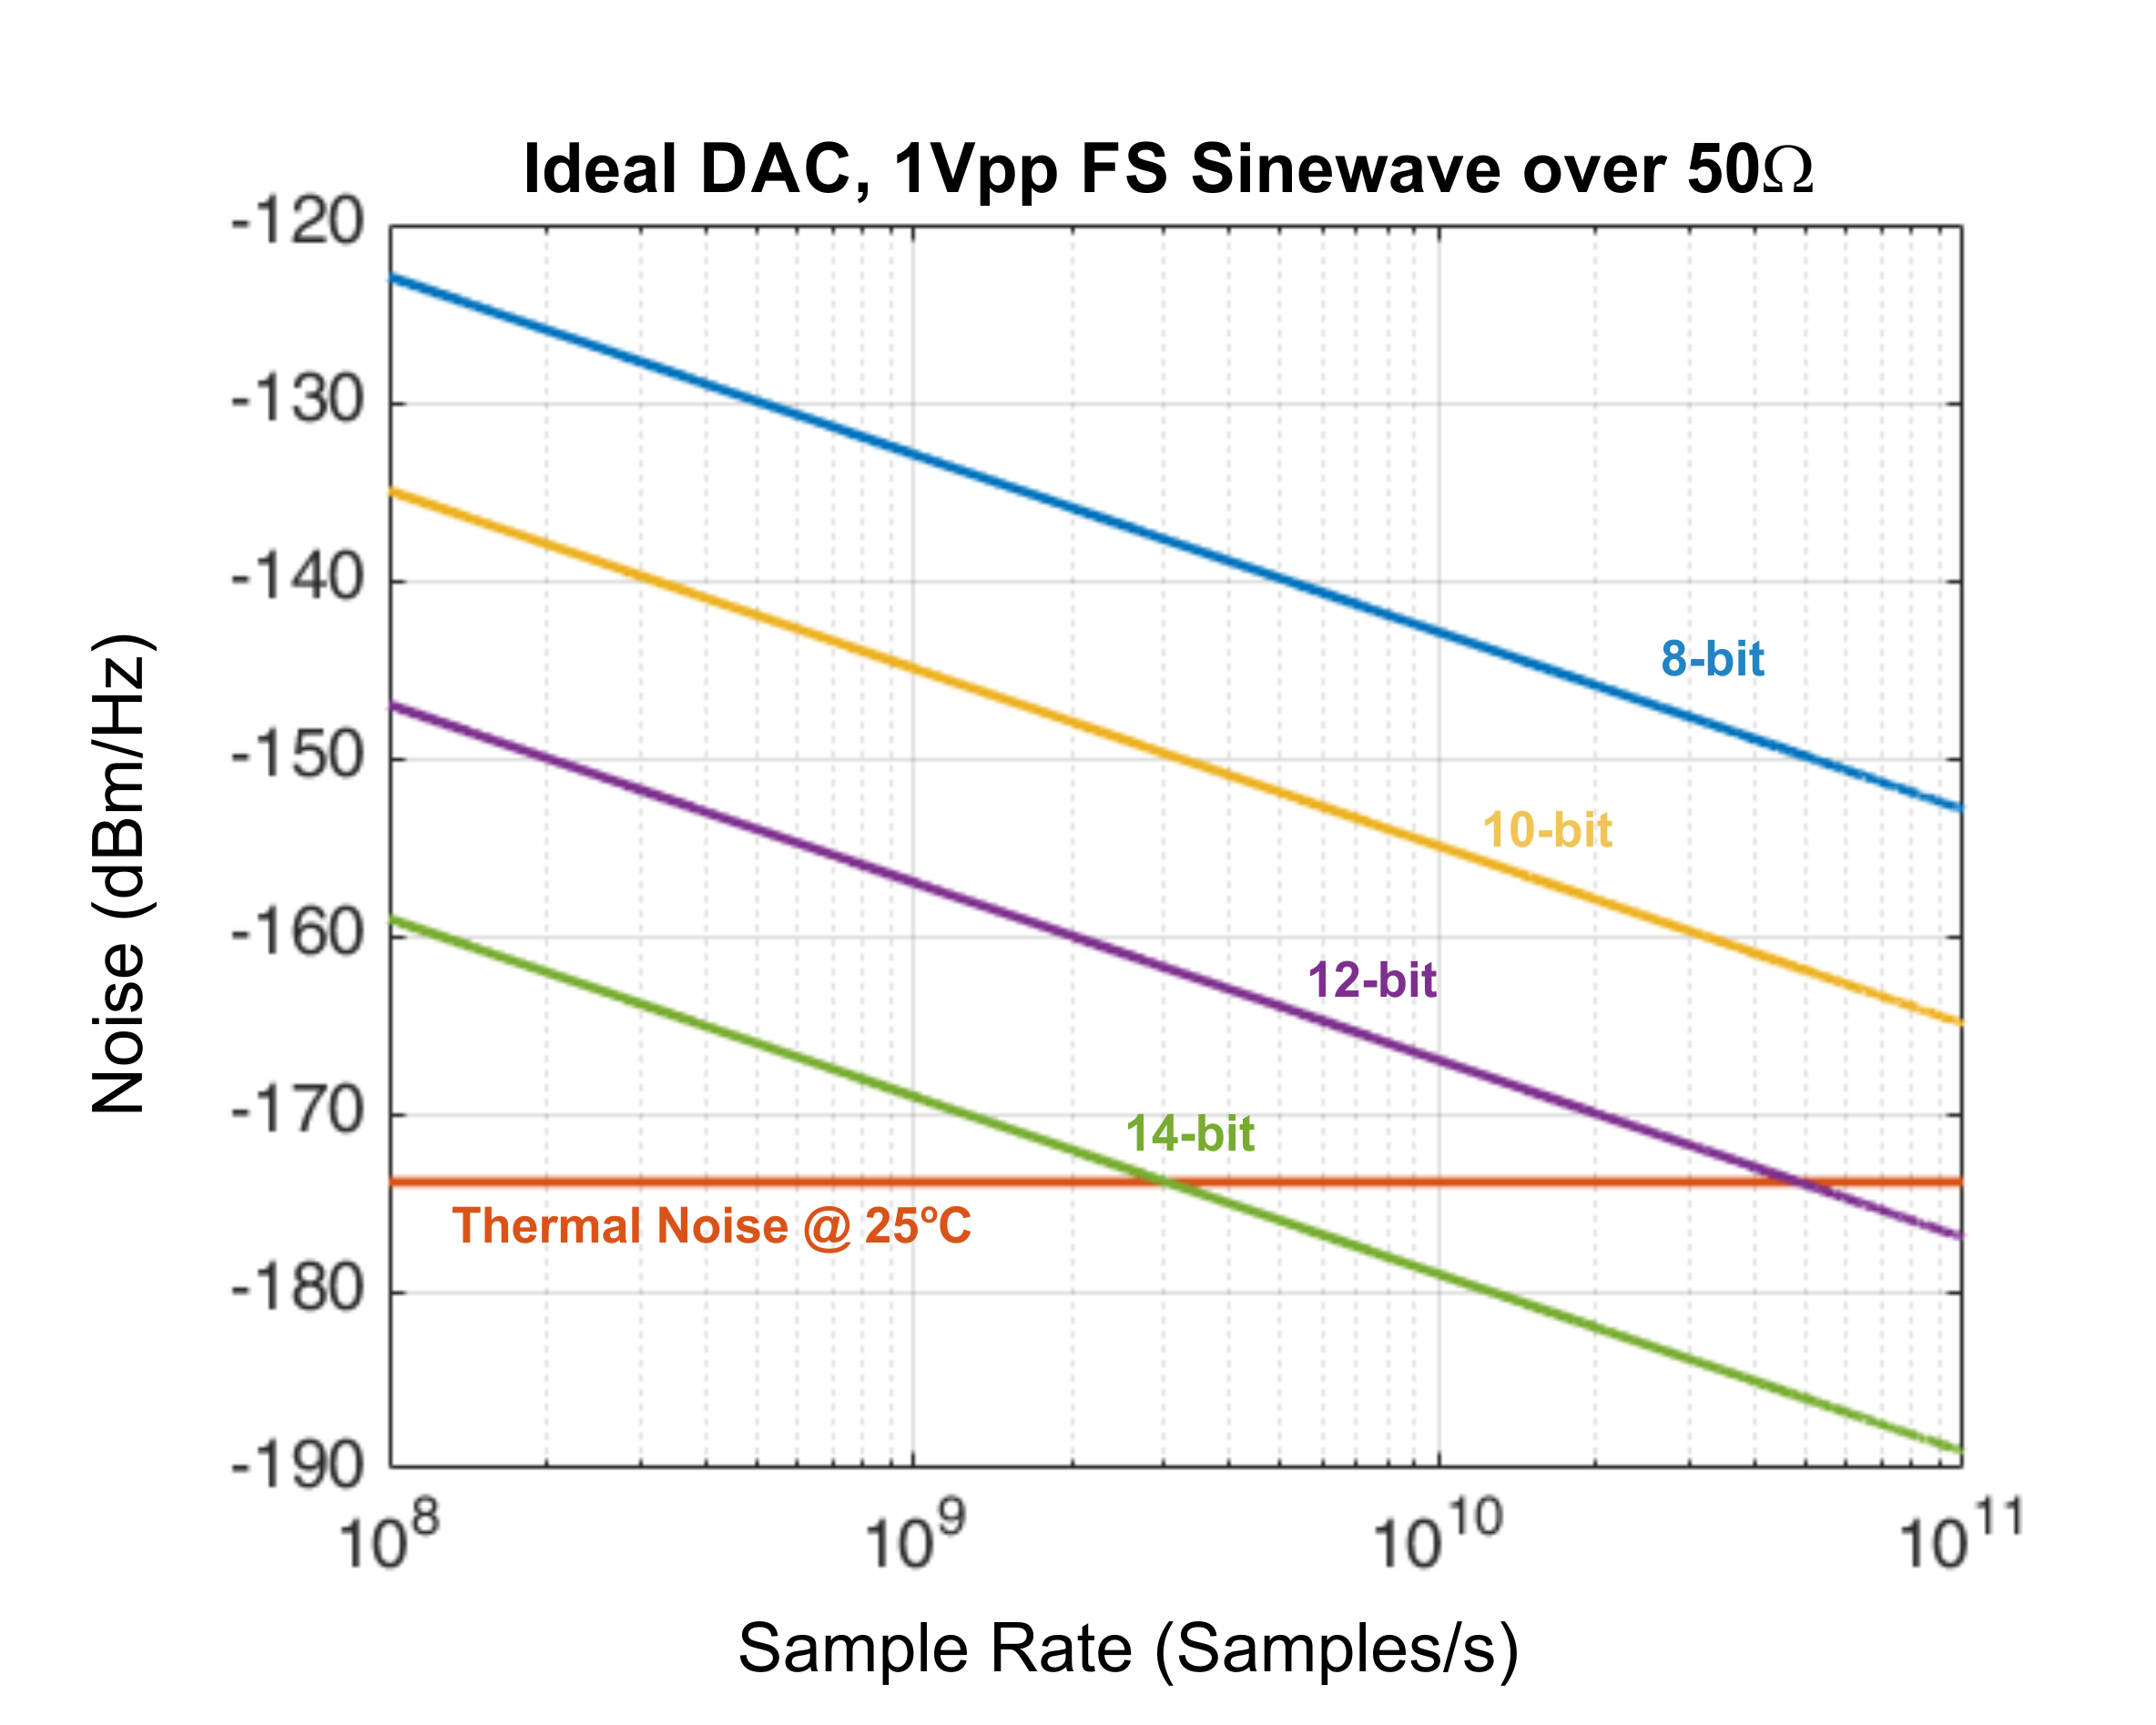
Figure 1.2: Quantization noise is not the only noise component at the output of an AWG. Thermal noise is an unavoidable noise source. While the total power of quantization noise remains constant with the sample rate, the thermal noise power is proportional to the usable bandwidth of the generator. In this graph, ideal quantization noise power density (NPD) for different resolutions of the DAC is shown. Thermal noise NPD remains constant, and for some specific sample rates, quantization noise is equal to it. For AWGs with higher sampling rates than this threshold, there is no real improvement in signal quality by using a higher resolution DAC.
SINAD (Signal-to-Noise-And-Distortion Ratio), see Figure 1.3: is another fundamental parameter that can be used to characterize any undesired signal being generated by a DAC. SINAD is defined as:
SINAD = (PS + PN + PD) / (PN + PD) (11)
SINAD(dB) = 10 log10(SINAD) (12)
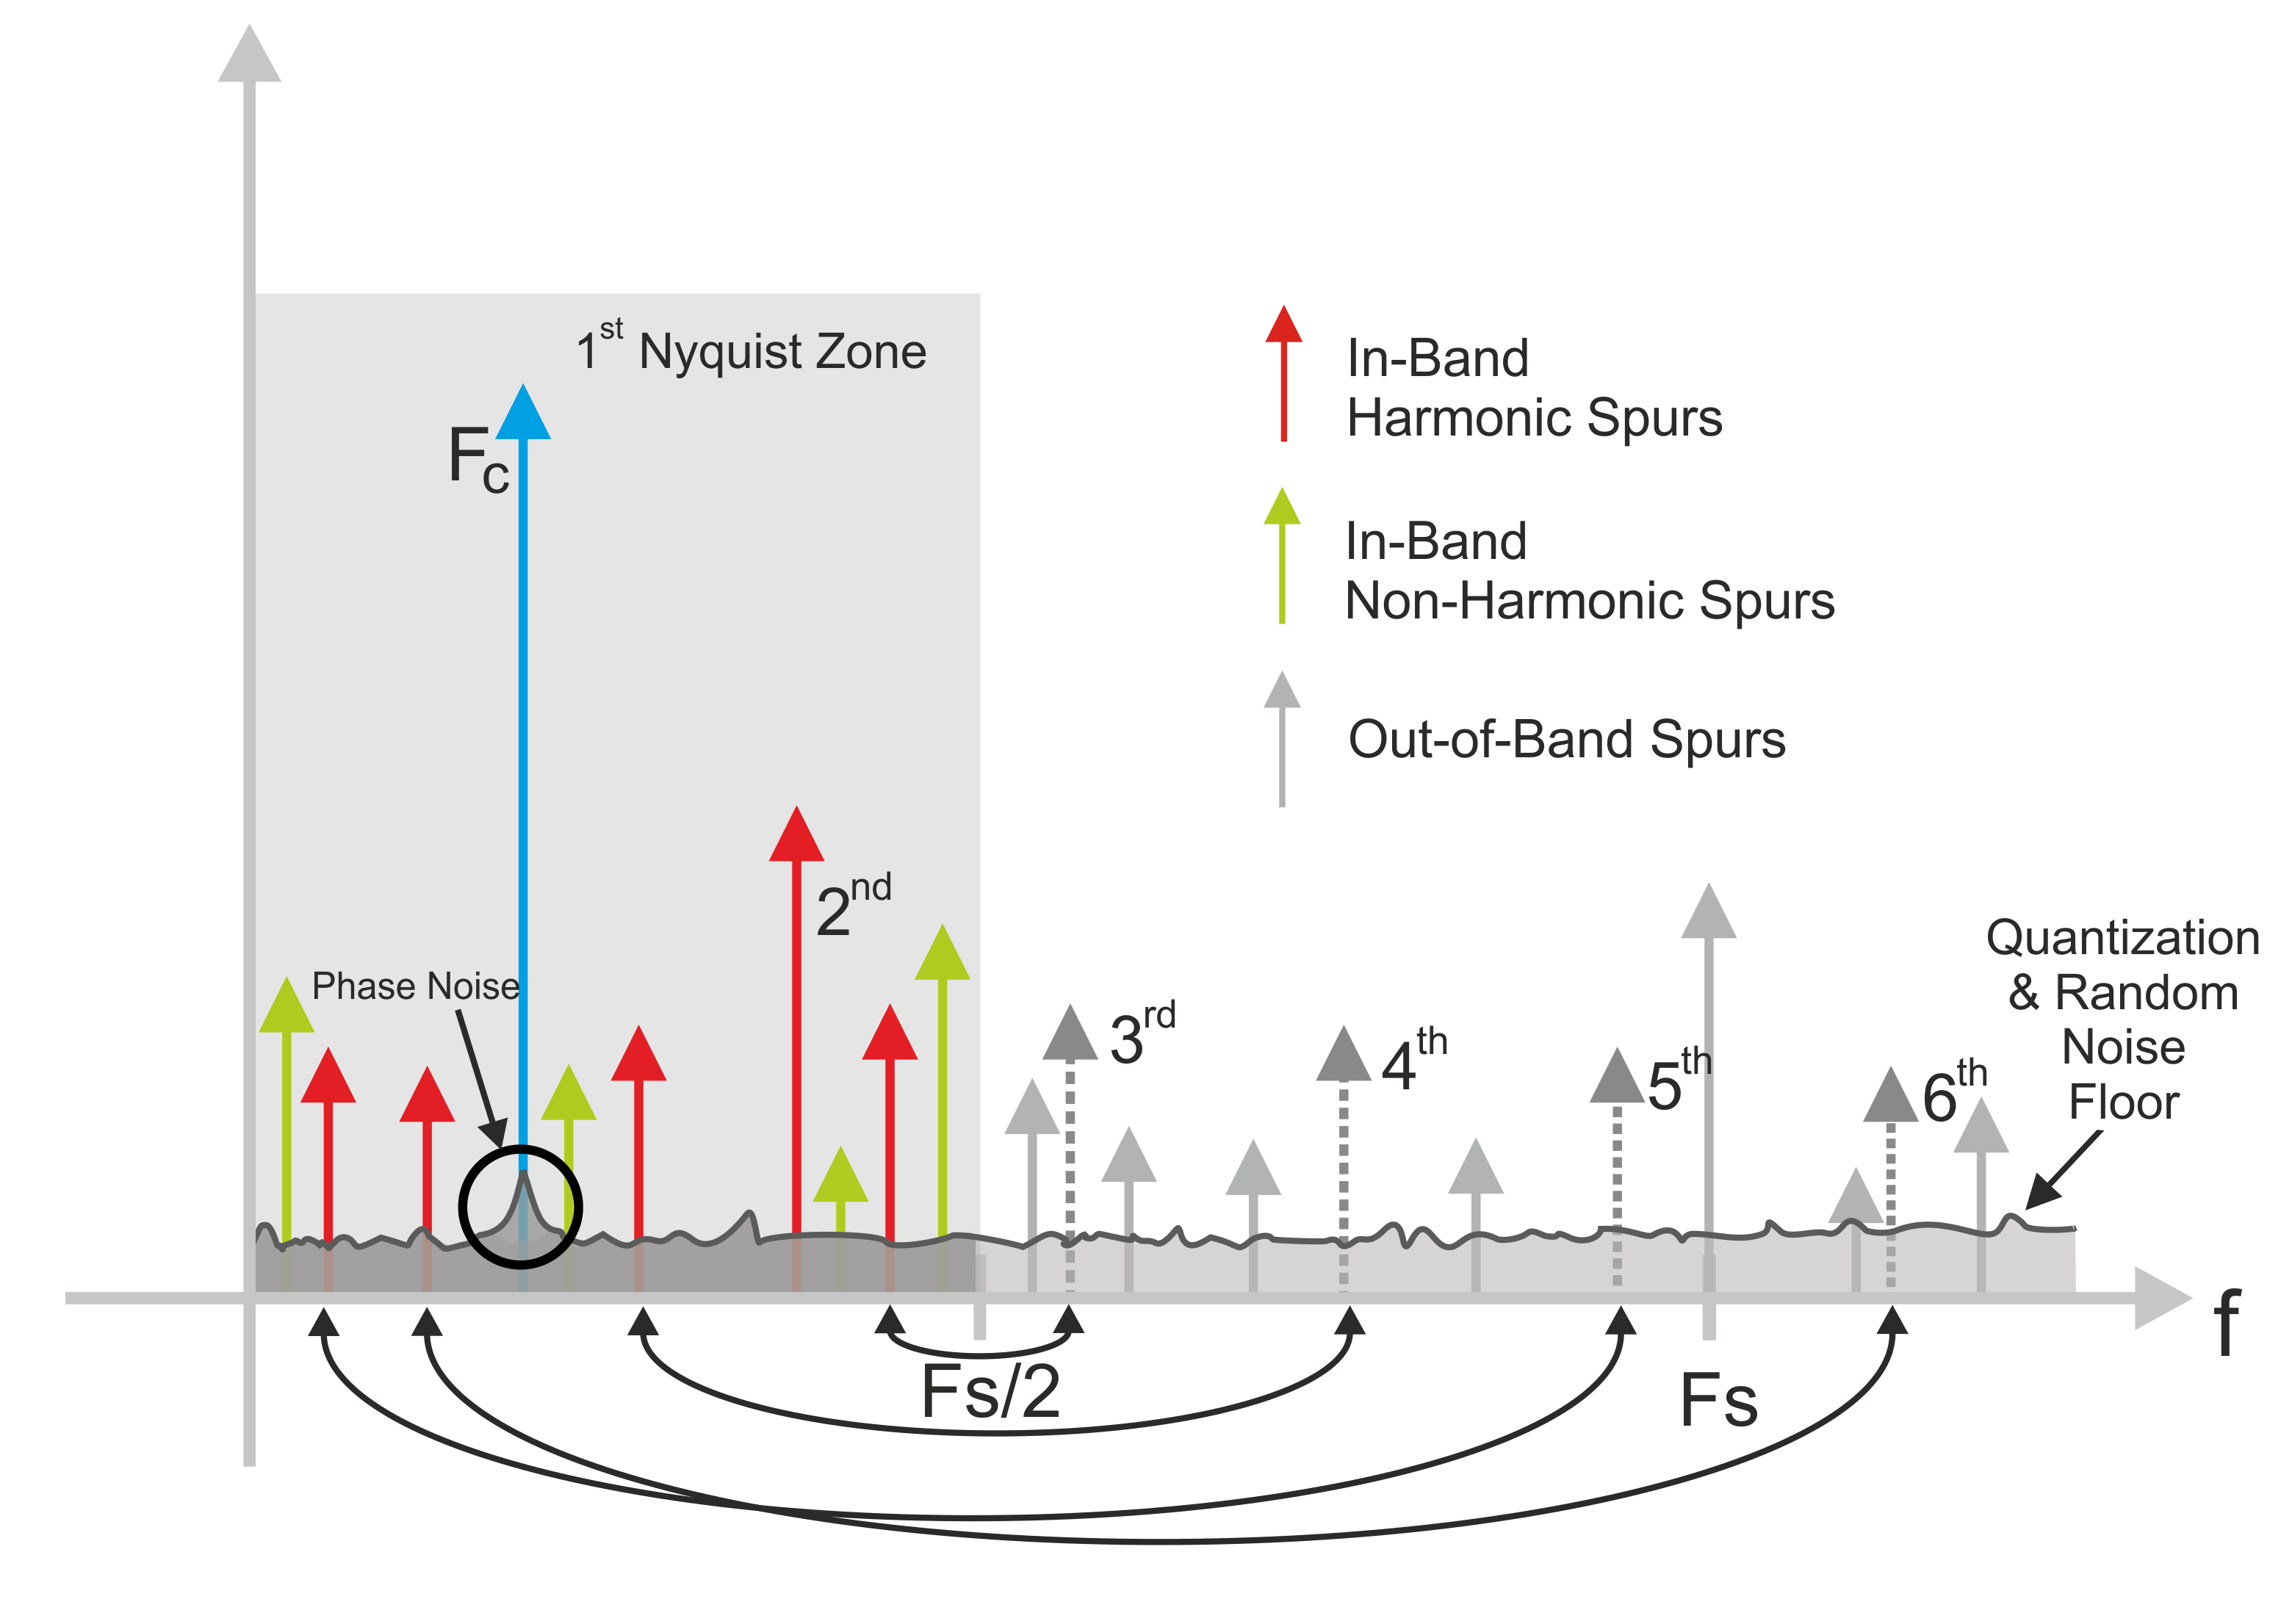
Figure 1.3: When generating a pure sinewave, an ideal, infinite resolution DAC would produce just the original sinewave plus multiple images around multiples of the sampling rate. Real-world AWGs produce many more components such as harmonics, random noise, phase noise and jitter, spurs, and quantization noise. The SINAD (Signal to Noise ratio and Distortion) quantifies the ratio between the desired signal and the undesired components within the Nyquist Bandwidth (DC-SR/2). Keep in mind that harmonics beyond the Nyquist frequency will be folded down to the first Nyquist Band as non-linear distortion will be also affected by sampling. SINAD is the basis for the ENoB (Effective Number of Bits) for AWGs.
The Effective Number of Bits (or ENoB) specification is just a convenient way to specify the same fundamental phenomena in an easy-to-understand single figure. ENoB simply applies expression (10) to SINAD
ENoB = (SINAD(dB) - 1.76) / 6.02 (13)
One way to interpret the ENoB specification is by assuming the number of bits in the DAC that are meaningful for a specific frequency. However, this specification is difficult to apply directly to a signal more complex than a sinewave. This becomes especially problematic when attempting to compare the overall noise and non-linear performance of different digital-to-analog conversion devices. Noise Power (PN) in expression (11) includes several components such as quantization noise, switching noise, thermal noise, sampling clock phase noise and crosstalk. Distortion Power (PD) is composed of harmonics and sub-harmonics. It is also important to remember that harmonics beyond the Nyquist frequency will show up as folded-down images in the first Nyquist band.
At first sight, ENoB should be always lower than the nominal DAC resolution as the overall noise will always include quantization noise and some additional noise and distortion. However, in many applications, just a fraction of the Nyquist band is used. This fraction can start at DC or be located around any frequency with a specified bandwidth. In this case noise and distortion out of the band of interest can be removed from the analysis. A good rule of thumb is to assume ENoB grows by one additional bit when the sample rate is multiplied by four. This process is called Oversampling which creates what we call Processing Gain. As a result, ENoB can be higher than the nominal resolution of the DAC when oversampling is applied.
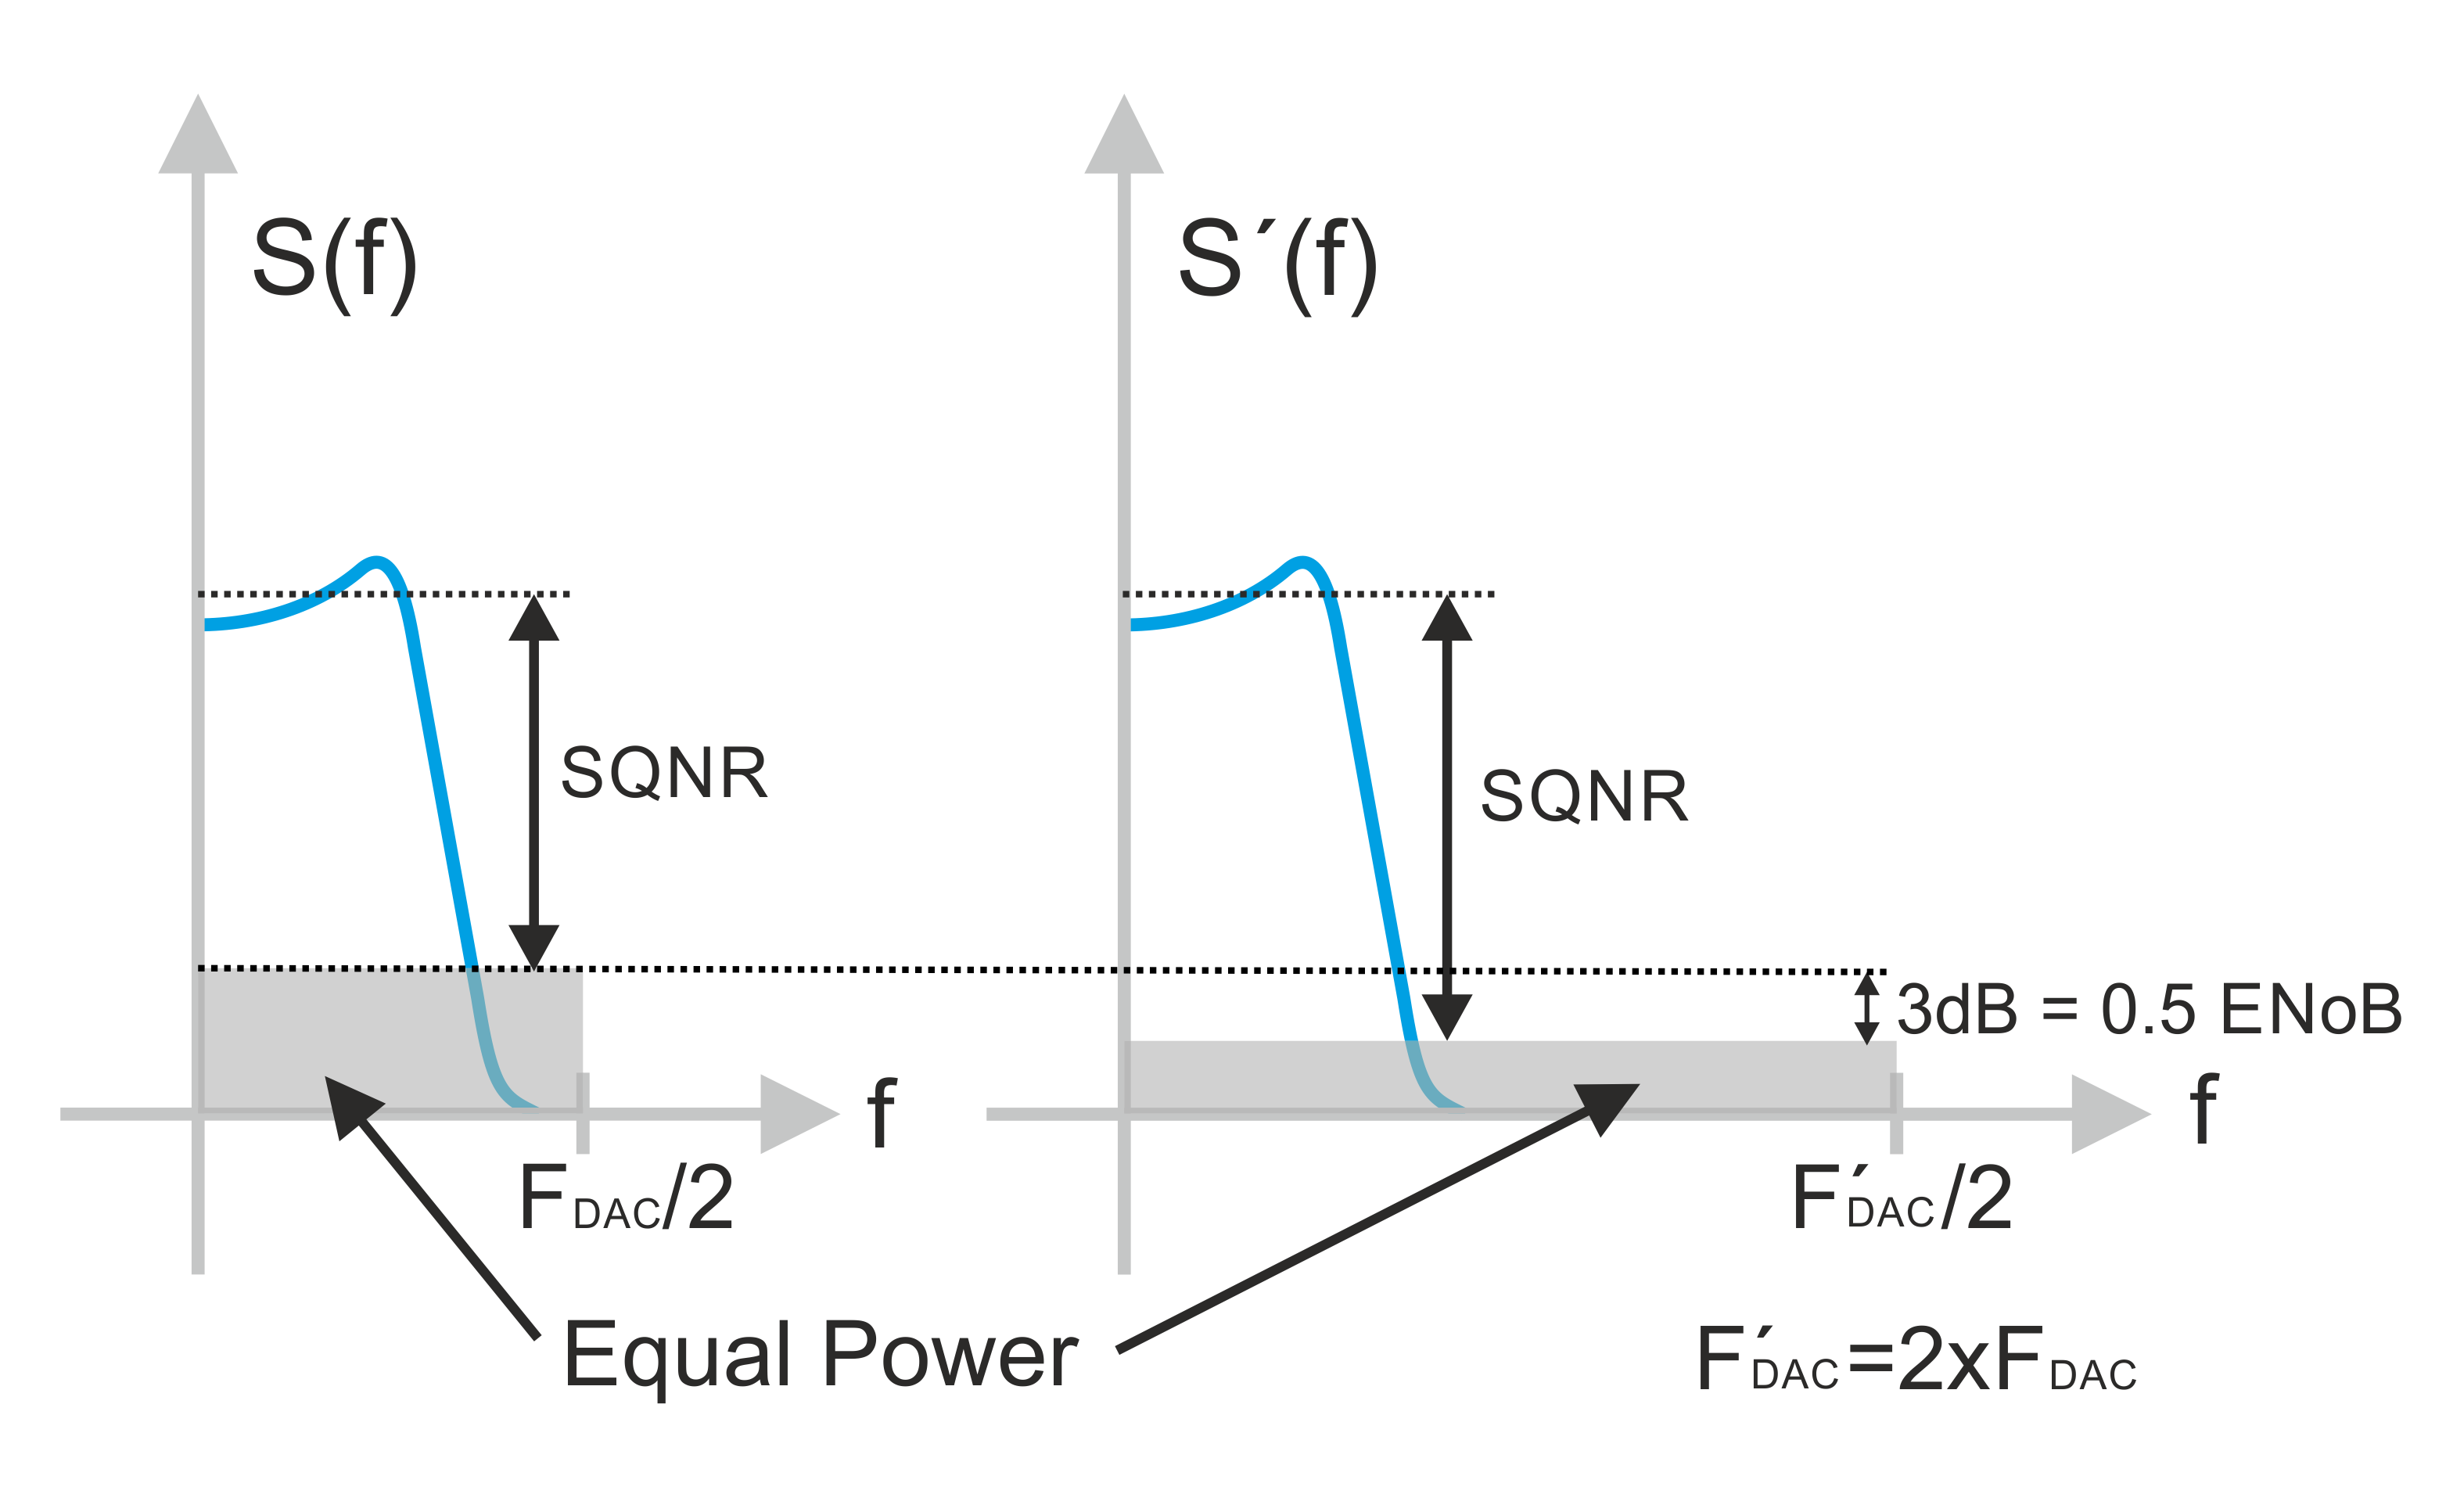
Figure 1.4: Quantization noise is spread all over the usable bandwidth of the AWG. This means that increasing the sample rate while keeping the same resolution of the DAC will result in a reduction of the NPD (Noise Power Density) as total power remains the same. The SQNR (Signal to Quantization Noise Signal) will improve by 3dB when sampling rate is doubled. This is equivalent to using a DAC with 0.5 more bits of effective resolution.
Finally, there are additional sources of error and noise:
- DAC and output stage non-linearities, both static and dynamic
- DAC switching glitches
- Increased thermal and random noise caused by electronic noise and crosstalk
- Non-flat frequency responses including zeroth-order hold DAC response
- Sampling uncertainty and sampling clock phase noise.
Noise, static, dynamic, linear, and non-linear performance of DACs (and AWGs) can be characterized through many different specs. Although many of them are straight-forward, others can be measured in different ways depending on the device manufacturer. To standardize the performances of DAC’s the IEEE released the standard “IEEE 1658-2011 - IEEE Standard for Terminology and Test Methods of Digital-to-Analog Converter Devices”. The standard defines noise and distortion measurements using sinewaves which can represent different sampling rate, test tone frequencies and amplitude.
Chapter 2 - Measuring ENoB in High-Speed AWGs
For more information: [email protected]