The IEEE 1658-2011 standard covers some test methodologies to obtain the SINAD parameter, so the ENoB specification can be directly calculated using expression (13). One of the methods, Figure 2.1: a), is based on acquiring the test signal (a sinewave) being generated by the DAC with a suitable ADC. Examining the signal in the frequency domain or breaking the signal into its constituent parts using an FFT (Fast Fourier Transform) allows us to identify and evaluate the signal. Now we can add together the power of all the spectral lines and extract the one corresponding to the test tone provides us with all the terms required to evaluate SINAD by using expression (11). A note of caution when making measurements - if the measurement device, say a Digital Storage Oscilloscope (DSO) - has an ENoB less than that of the DAC you would be simply measuring the ENoB of scope and not the device. To produce meaningful results, the ADC of the test instrument (DSO) used for the characterization must be better than the expected ENoB performance by at least 4 times (2 bits). Although, this may be feasible for low sample rate DACs, it is not for high-speed DAC’s or AWG’s. However, you can apply a tuned notch filter to the DAC output, so the fundamental test tone is removed, Figure 2.1: b). The signal at the output of the filter will contain all the unwanted signal components so its overall power combines all the noise and distortion components. This signal can be easily digitized and analyzed by the DSO utilizing the full dynamic range of the instrument, making the scope’s own noise and distortion irrelevant. Frequency-domain processing (FFT or digital filtering) can be used to remove any remaining component of the test-tone further improving accuracy, also making the accuracy of the notch frequency not as critical. This method though does have drawbacks. The first one is related to the notch filter. The frequency response of the filter must be properly characterized so noise and distortion components are corrected according to their frequency. Additionally, the notch bandwidth in high-frequency filters may be wider than ideally required, so a fraction of the noise power may be lost resulting in a decrease in accuracy. The second drawback is an operational one, as we require one filter for each frequency to be characterized, which adds time and effort with respect to designing and characterizing multiple filters.
Improvement of the measurements can be achieved by utilizing a spectrum analyzer and some new measurement techniques developed by Tabor Electronics. Spectrum Analyzers differ from Oscilloscopes as they are essentially narrowband tunned receivers (defined by the resolution bandwidth of the analyzer), as opposed to an oscilloscope that is a broadband instrument. By utilizing the narrow bandwidth, the dynamic range and bandwidth required to characterize the high-speed DACs can now be realized. The spectrum analyzer can be tuned to measure the power of the test tone and all the signal components, Figure 2.1: c), thus accurately obtaining the SINAD parameter.
AWGs generate a tone by looping an integer number of cycles stored in the waveform memory. The signal must be calculated in such a way that all the quantization levels are used, and the exact same sequence of samples is not generated more than once in a single loop. What this means is that any SINAD component linked to the waveform, such as quantization noise, will also repeat, Figure 2.2 . This means that quantization noise will show up as pure tones at multiples of the repetition frequency and
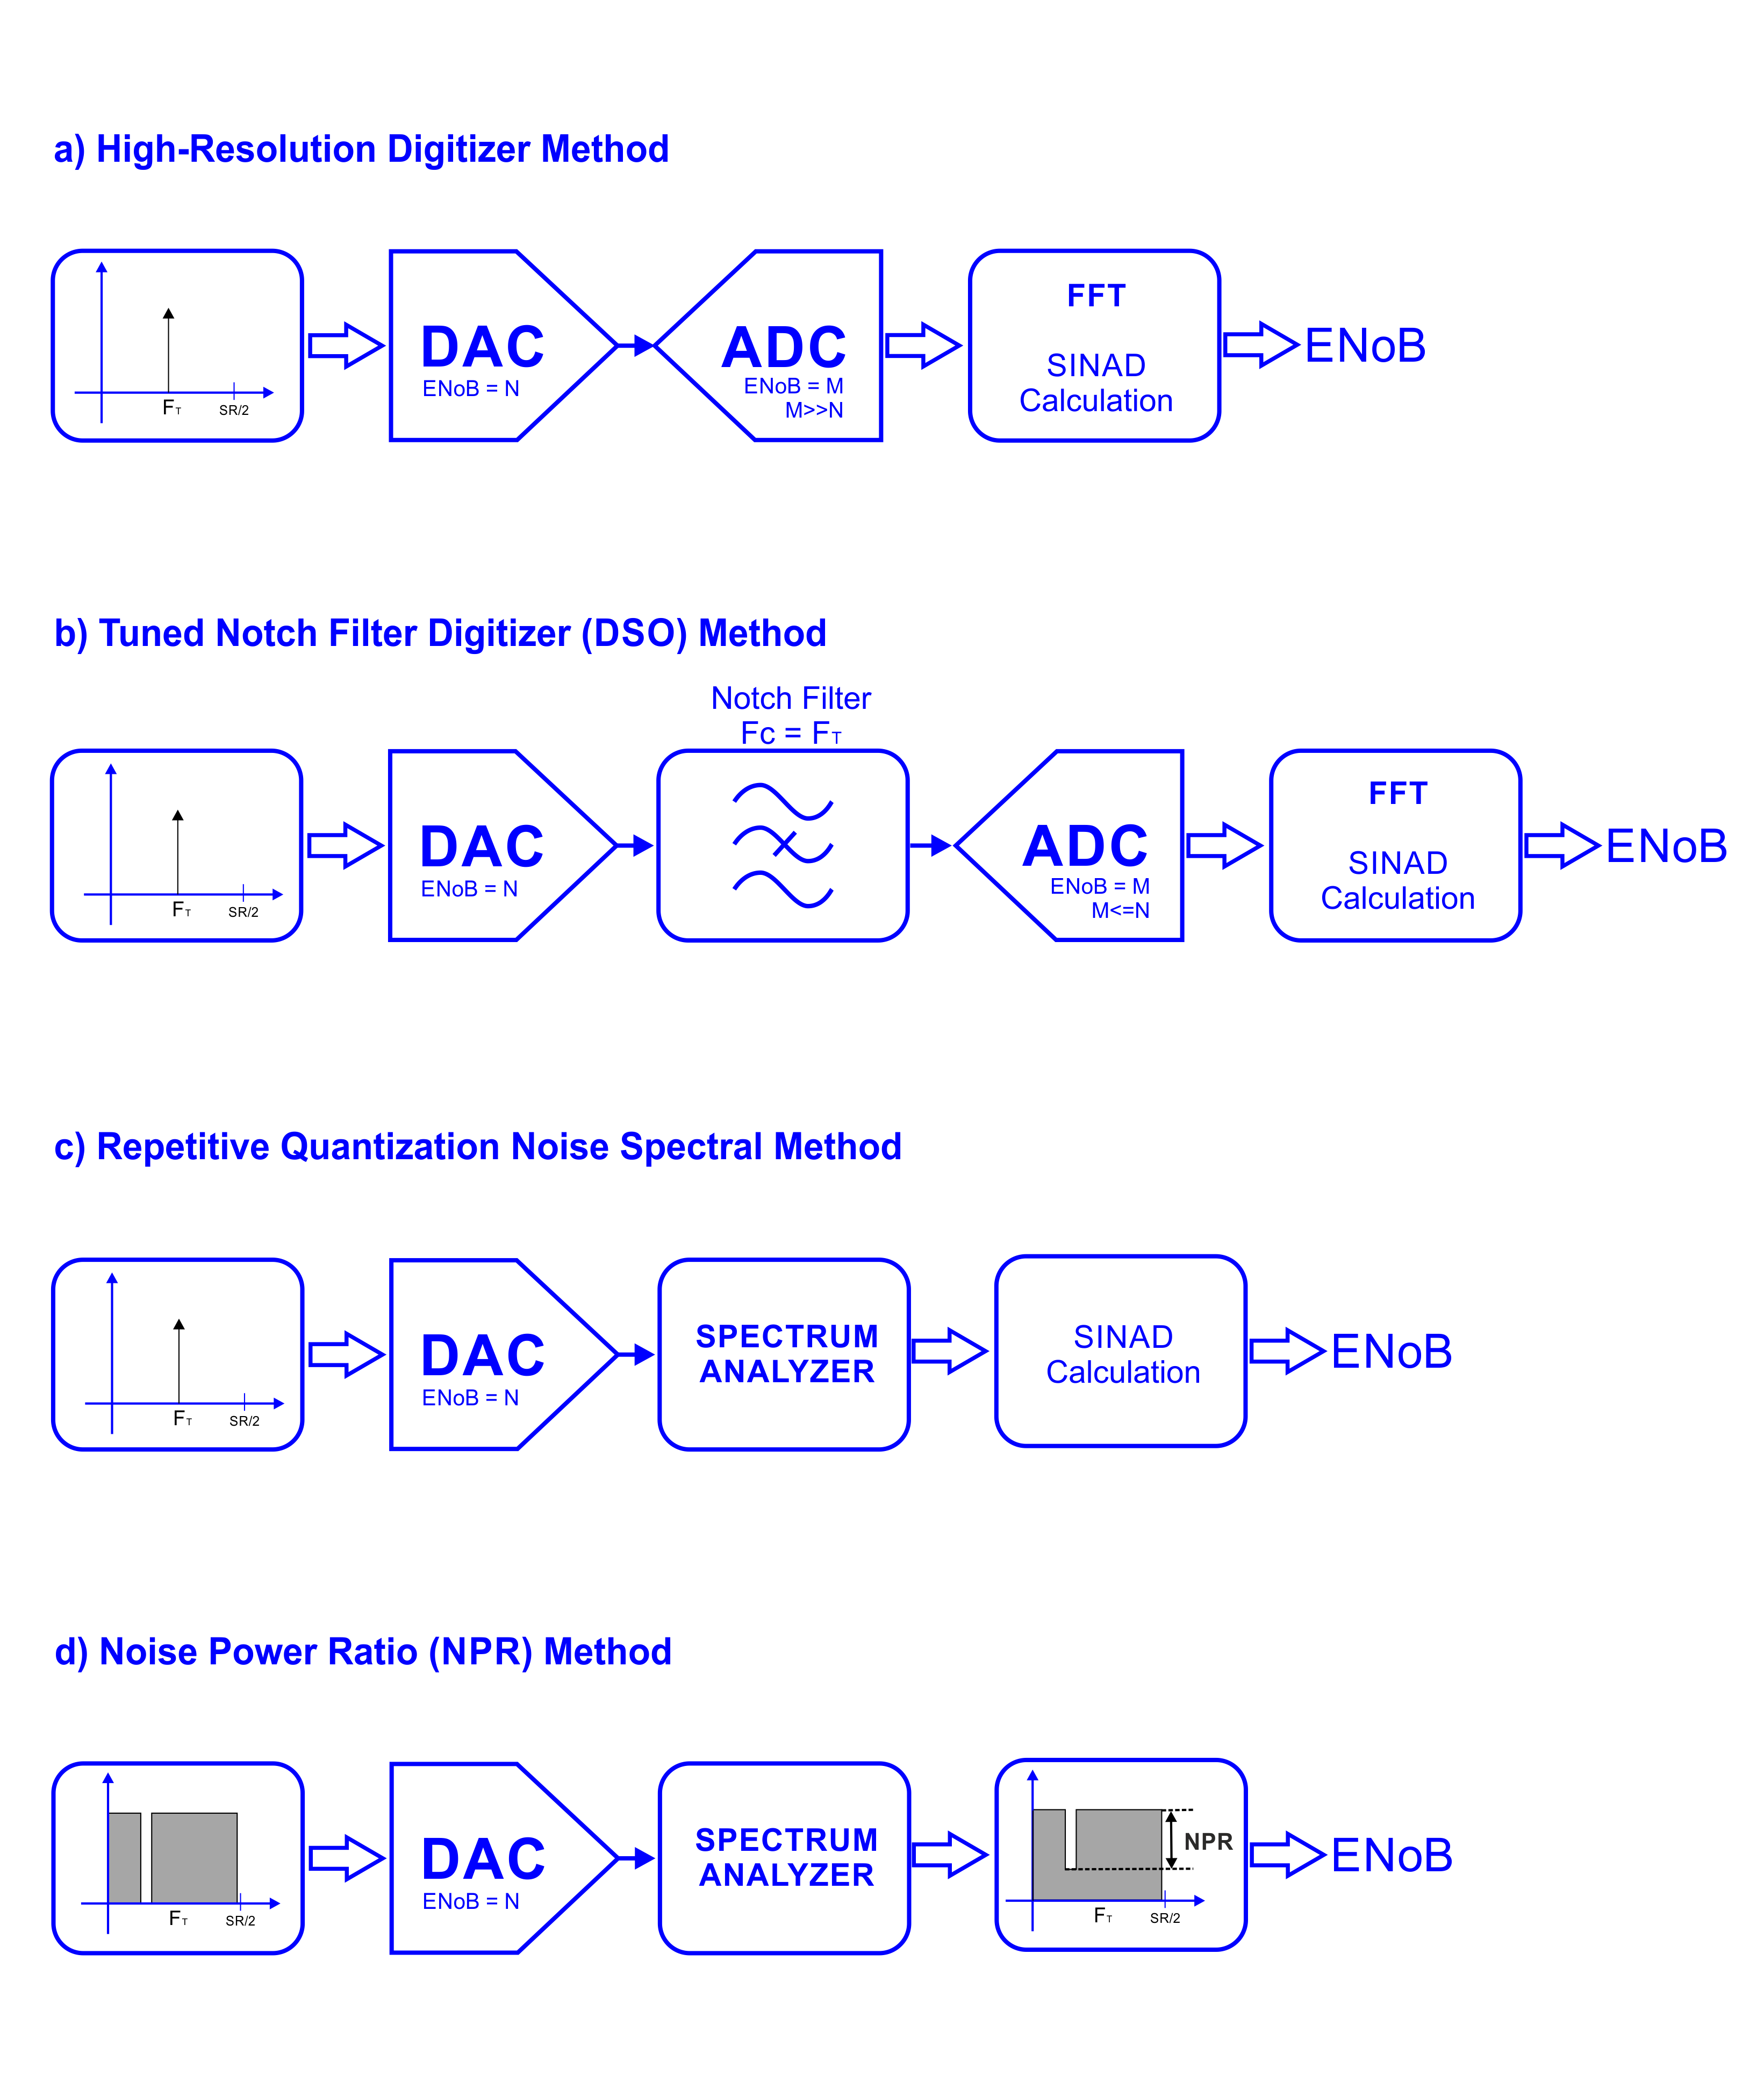
Figure 2.1: There are several methods to obtain the ENoB (Effective Number of Bits) parameter. Some of them (a, b. c) try to measure SINAD directly using multiple methodologies. Others, like the NPR (Noise Power Ratio) method (d) show the ENoB parameter indirectly. Test signals are also different. The SINAD based methodologies use single frequency sinewaves while the NPR method uses wideband random-like test signals.
they will be visible over the background, wideband noise. The background wideband noise must be corrected to extract the noise generated by the analyzer itself. Obtaining the overall narrowband components (quantization noise, clock feed-through, harmonics) and the corrected wideband noise results in the calculation of the SINAD parameter and ENoB. As the different components of SINAD (wideband noise, quantization noise, clock feed-through, harmonics, sub-harmonics, etc.) can be separated, this information can help to fully characterize the behavior of the AWG.
Another ENoB measurement technique using a Spectrum Analyzer is the NPR (Noise Power Ratio) technique, Figure 2.1: d). This methodology is very popular for ADC (and digitizer) testing however the same principle can be used for DACs as well. This technique uses a random wideband noise (ideally
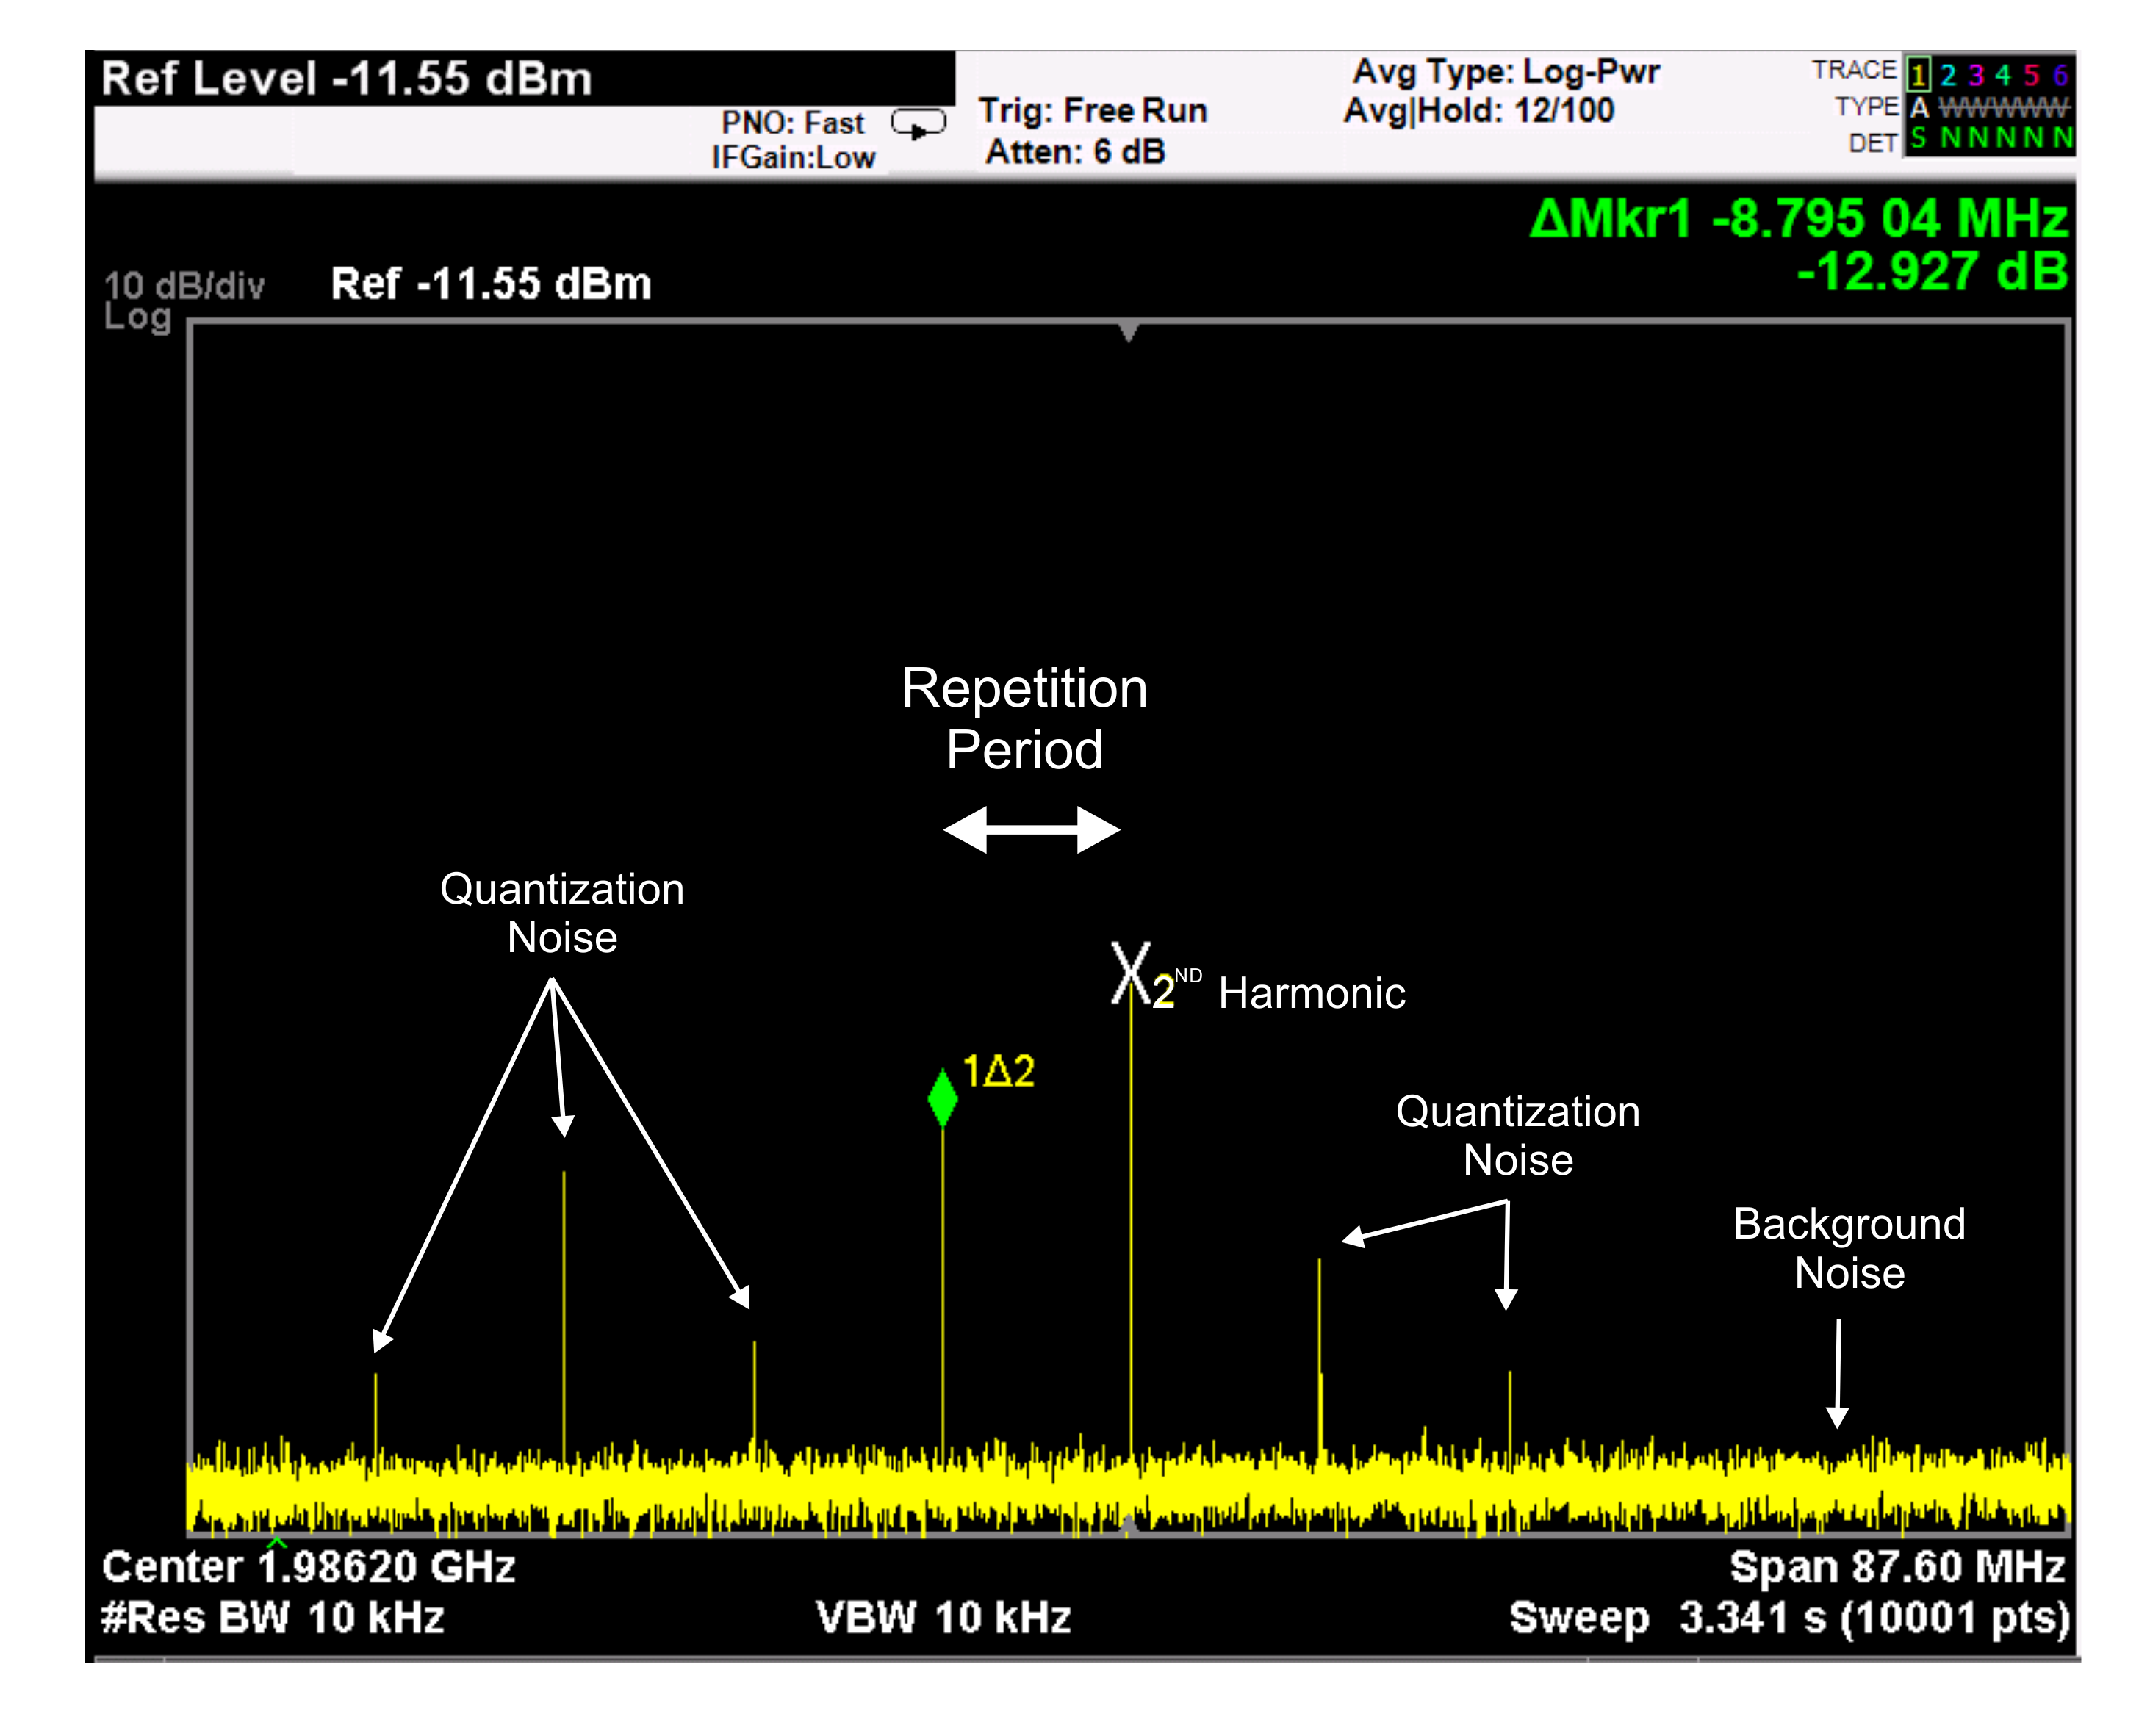
Figure 2.2 The Repetitive Quantization Noise Spectral Method can be implemented using Spectrum Analyzers as the measurement device. As the test signal repeats with some known period, quantization noise will also repeat, it shows up in the spectrum as discrete spectral lines at known frequencies. In this example, some of these spectral lines are shown for a 1GHz test tone. The line in the middle corresponds to the second harmonic while the other lines are caused by quantization noise. The background noise must be also measured and requires a separate procedure.
Gaussian) with a “notch” in it. The width of the notch must be a fraction of the AWG Nyquist band and it may be located at different central frequencies. For a perfect notch filter and DAC, the ratio between the noise power in the notch and that of a similar BW out of the notch as seen by a Spectrum Analyzer depends on the DAC resolution (NoB) and the PAPR (Peak-to-Average-Power-Ratio) is:
NPRdB = (NoB – 1) * 6.02 - PAPRdB + 10.79 (14)
In a real DAC, the actual NPR result can be used to obtain the ENoB by using the below expression:
ENoB = 1 + (NPRdB + PAPRdB – 10.79) / 6.02 (15)
This method can be used at different frequencies so ENoB can be characterized as a function of frequency, Figure 2.3: . However, the test conditions are very different from the test-tone methods described previously. In this case, a wideband signal is used, so the ENoB parameter will be more realistic for wideband signals. This is key when we want to understand the performance of the DAC with modulated signals, not just discrete sine waves.
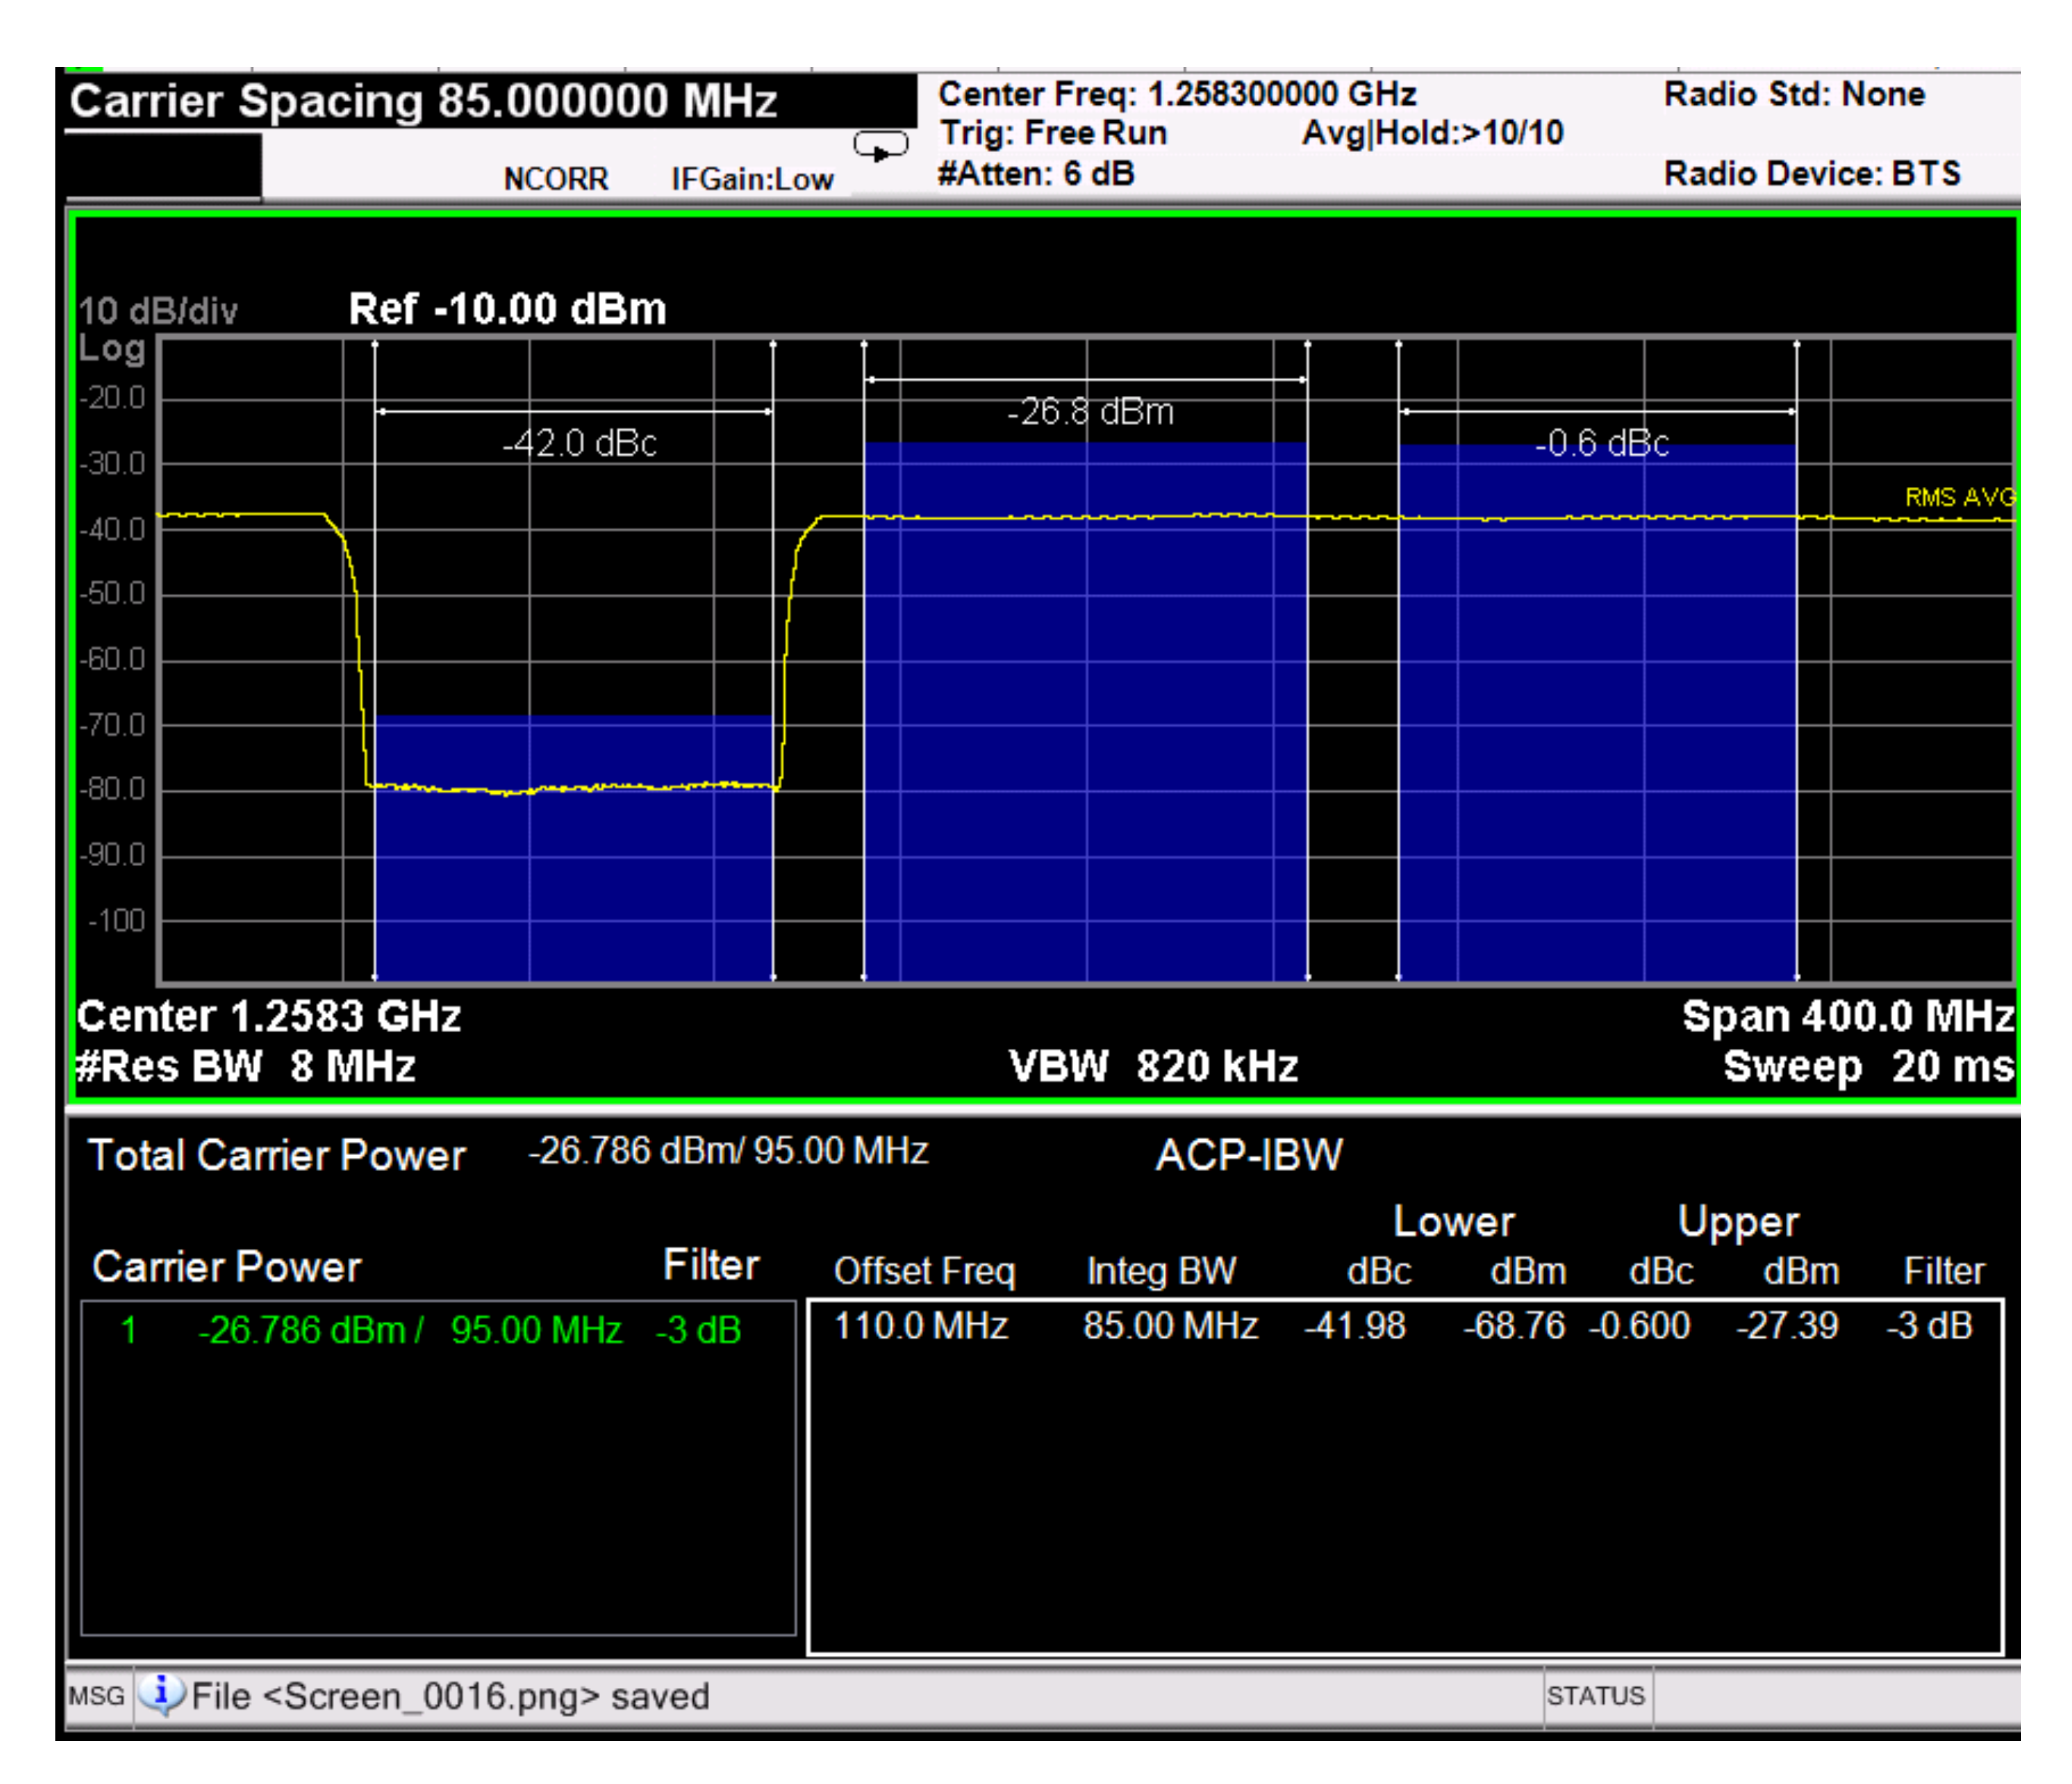
Figure 2.3: The NPR method derives the ENoB parameter from the power ratio between a notch in the spectrum and a close section of the same bandwidth of the non-filtered signal. In this example, an 8-bit, 9GSa/s test signal (multi-tone waveform with a notch around 1.1GHz) is generated. After computing the NPR (42.0 dB) and PAPR (10.3 dB) values, ENoB for this DAC is 7.85 bits.
The online Windows XP simulator runs in a web browser and its operation imitates the operating system. You can use it to prank someone.
Part 3 - Impact of ENoB in Actual AWG Performance
For more information: [email protected]