Nuclear Magnetic Resonance (NMR) Spectroscopy is a technique used for determining the structure of organic compounds. For scientists to be able to measure the exact structure of compounds to understand their properties is key.
Theory
Some nuclei possess a magnetic moment - such as a hydrogen nucleus 1H, or a carbon nucleus 13C. When you place these in a strong magnetic field the magnetic moment or spin of each nucleus will align with the magnetic field of the magnet.
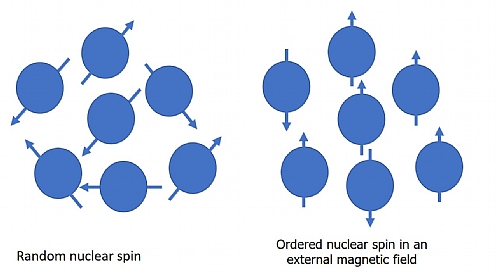
Figure 1 – Spin alignment in a strong magnetic field
If you apply some resonant RF energy it will cause the nuclei to jump to a higher-energy state and the nuclei magnetic moments will rotate or process. When the energy is removed the same frequency is emitted. This is what we measure. Consider Figure 1. If we want the nucleus to move to a higher energy state, we apply some electromagnetic energy of a frequency that is equal to the desired energy level minus the current energy level divided by Planck's Constant. The nucleus will absorb the energy and jump to the next quantum energy level. Once the energy is removed, it will fall back to its original level, emitting the energy at the frequency it previously absorbed. The frequency of the stimulus is key, not the amplitude. Increasing the amplitude will not cause the nuclei to move to a higher energy level, but increasing the frequency will.
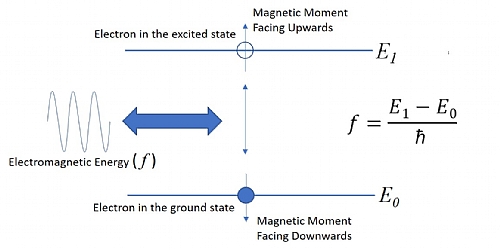
Figure 2 – The correct resonant frequency is key in NMR
As previously discussed, Nuclei also possess a type of angular momentum called spin. As the nucleus moves from one energy level to another, the spin momentum changes. At the lower energy level, the momentum is pointing down or a ‘spin-down’ state, when electromagnetic energy is applied, the spin changes until the momentum is pointing upwards as the electron achieves the next energy level. This is the spin-up state. When the nucleus state can be defined this way, it is said to possess an eigenstate, as both position and momentum are known and can be quantified through measurement.
Making a measurement
The ‘Sample’ to be analyzed is placed within a large magnetic field – the magnets’ field can vary and is related to the resonant frequency that we wish to measure – it is usually in the form of a superconducting magnet. A probe is also placed within the magnetic field – this contains the antenna that is used to transmit resonant RF frequency at the sample. The same antenna is used to receive the emitted energy as the energy levels decay or relax back to their original state. The amplitude of the emitted resonant frequency is measured, and the decay can be plotted on a graph. This is called the Free Inductive Decay or FID. If an FFT is taken of the FID curve you will see the spectra of the molecules that make up the compound.
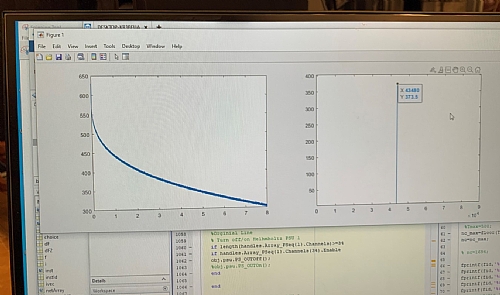
Figure 3 FID Curve and FFT showing the NMR Spectra
Measurement Setup
Traditionally an LO, mixer (upconverter) and arbitrary waveform generator would be used to generate the appropriate resonant RF pulse. A sensitive RF receiver or lock-in amplifier would be used to measure the emitted energy as the energy levels decay. With a product such as the Tabor Proteus a direct to RF or Microwave pulse can be generated, and the wideband digitizer option of the arbitrary waveform transceiver can be used as the receiver. Figure 4 Shows a typical measurement setup.
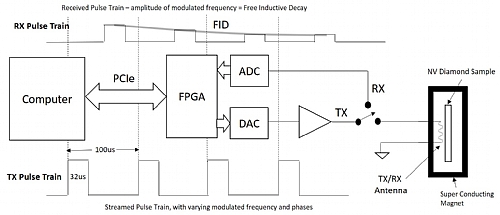
Figure 4 Typical Setup of an advanced NMR measurement system.
Proteus also has a tightly couple Generation and Analysis Architecture. Therefore advances can be made in pulses characteristics and measurement analysis, helping create the next generation of high-Resolution NMR measurement capability. Figure 5 shows an experimental setup at UC Berkeley in California – comparing LO and low sample rate AWG to the direct to microwave capability of Proteus. Proteus significantly reduces the footprint of equipment required to perform NMR measurements, while speeding up the measurement process by orders of magnitude.
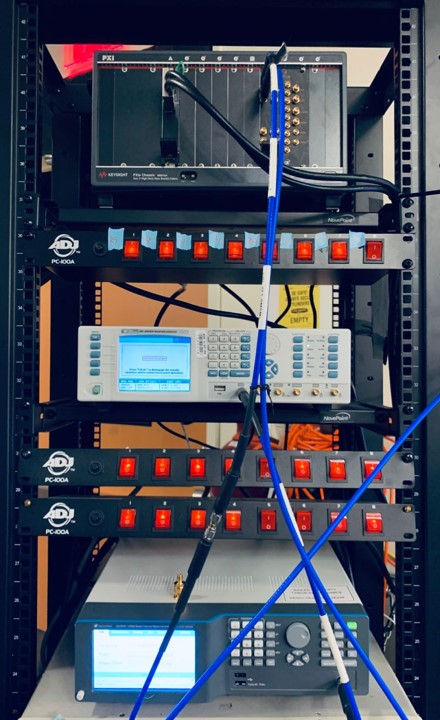
Figure 5 – Experimental Setup at UC Berkeley, California USA
Proteus Provides the following capabilities:
- 2/4 single ended/differential independent or synchronized output channels.
- Max 9GS/s sample clock rate.
- Up to 9GHz bandwidth.
- 16 bits of vertical resolution.
- Max amplitude of 1.2Vp-p.
- Multiple instrument synchronization.
- Controllable Channel delay and Skew resolution.
- Extremely low noise and excellent spectral purity.
- Up to 16GS of waveform memory.
- Additional up to 16 marker output
- Optional Digitizer – 5.4GS/s with 9GHz of analog BW
For more information [email protected]