Real-World high-speed arbitrary waveform generators and digitizers cannot implement a perfect flat frequency response with a linear phase (fixed delay) behavior over the full bandwidth. Even more, it is virtually impossible to reproduce exactly the same response for all the instruments and, even, for all the different channels in the same device. Some applications can cope easily with such limitations. Others, such as qubit control or wireless test, cannot. The solutions to this problem are calibration and corrections. Additionally, the frequency response of the generator is just one of the factors influencing the overall response. It is also important to characterize all the signal chain including cables, connectors, amplifiers, filters, attenuators, fixturing, and any other item that can influence the response. In some cases, frequency response data may be already available or can be obtained separately (i.e. as a S-parameter file in a standard format such as the Touchstone© format). For some others, it is better to characterize the system at once.
Knowing the frequency response (magnitude and phase) of any component in a test or control system is the first step. The concept of characterizing the linear frequency response of an AWG is quite simple. A known signal covering the band of interest is generated and the actual output after the signal chain is then characterized (Figure 3.1). The problem is solved after finding the frequency response that gives a better approach to the output waveform for the input waveform. In AWGs, generating signals suitable for calibration is relatively easy as these signals are defined as mathematically ideal waveforms. There are many candidate signals suitable for calibration. Some of the most useful signals consist in different multi-tone arrangements. Multi-tone signals are typically composed by equally spaced tones. Phase for each tone can be random or accurately controlled to improve the overall power. The higher the power, the better sensitivity, dynamic range, and noise resilience of the calibration performed. The “parabolic” phase distribution provides a near-optimal crest factor and a very good pdf (probability density function) over the whole dynamic range of the AWG’ DAC (Figure 3.2). Users can control easily the frequency resolution by controlling the spacing of the tones. Good quality calibration requires the disconnection between the quantization noise and the frequency response. Calibration signals are calculated in a way that an integer multiple of cycles fit in the time window resulting from the selected waveform length and sampling rate so it can be looped seamlessly without any wrap-around artifact. The minimum time widow must be, then, equivalent to one cycle of the tone of the minimum frequency to be characterized or the spacing between carriers. In most realistic calibration scenarios, both frequencies (minimum and spacing) are the same. The problem with this setup is that quantization noise and any non-linear distortion will repeat at the same frequency of the waveform so all the noise and distortion power will go to exactly the same locations of the calibration tones in a coherent way as the phase relationship will be constant and, as a consequence, both the amplitude and phase of the tones will be changed and the accuracy of the calibration compromised (Figure 3.3, a). In order to avoid that problem, the best way is fitting multiple repetitions of the original time window making sure they do not repeat exactly in the same way for each occurrence. This can be accomplished in two ways. The first one is just appending multiple copies of the same basic waveform and then apply dithering (just a very small noise addition to make sure that quantization noise does not repeat for every occurrence of the basic waveform). The second way to obtain a similar or better result is selecting an overall waveform length and an integer number of repetitions so every occurrence of the basic waveform requires a non-integer number of samples although the overall, combined waveform does (Figure 3.3, b). In both cases, noise will be distributed at multiples of the overall repetition frequency, much lower than the tone spacing, and just a fraction of it will fall in harmonics located at the same frequency calibration tones do. As the overall noise power is the same, the average power for the interfering harmonics is reduced in the same proportion. Repeating the same basic calibration signal 10 times will reduce the interfering noise power by 10dB.
The figure below depicts that signal source calibration is a quite straight forward process. AWGs are ideal as calibration waveforms are mathematically defined. Maximally flat response oscilloscopes are also ideal for this calibration process as any >10GHz scope bandwidth from any major manufacturer shows an extremely flat frequency response (internally corrected). Once the AWG + cabling + fixturing response is acquired, a correction filter can be calculated. This correction filter can be applied by pre-processing of the waveform before being transferred to the AWG or applied in real-time using an internal FIR implemented in the AWG’s DAC, whenever is possible as it happens in the Proteus AWG.
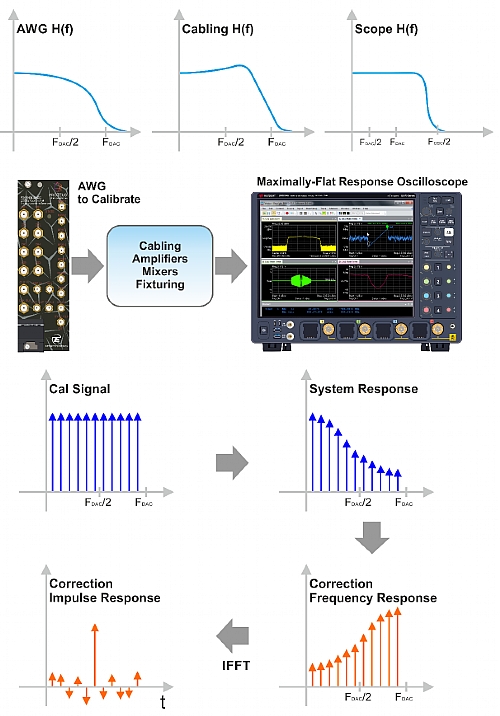
Figure 1.1 Signal Source Calibration
Figure below: A very useful signal for AWG and digitizer calibration is the multi-tone signal. It is made of multiple equally spaced, equal amplitude tones. The problem of such signals is their tendency to use unevenly the available DAC (or ADC) dynamic range and show a poor PAPR (Peak to Average Power Ratio). Both issues cause inaccurate, noisy results and boost the influence of any non-linear behavior in the calibration results. Fortunately, there are specially designed phase distributions for the tones that result in very low PAPR values and with a much more consistent distribution of the signal over the full converter dynamic range. Here, the parabolic phase distribution behavior is shown. PAPR is just 2.6dB as it is independent of the number of tones (constant phase distribution shows a 20dB PAPR while pure random phase distribution results in PAPR in the range of 7 to 12dB, both for 100 tones but this value grows with the number of carriers).
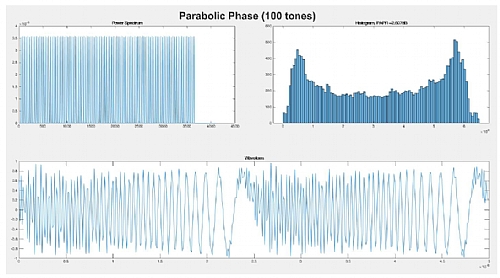
Figure 1.2 Multi-Tone Calibration Signal
Selecting the frequency resolution of the frequency response characterization is not a trivial task. The overall frequency response for a wideband system is a combination of effects that can be better described by either “lumped-element” or “distributed-element” models. While lumped-element frequency responses can be properly characterized by a rather coarse frequency resolution, distributed-element sections may require a much finer frequency resolution. A good example of such distributed-element behavior are cables and fixtures where reflections occur due to impedance-mismatches. The only way to correct for these reflections is by using long correction filters and those can only be obtained from high-resolution frequency responses. In other words, the length of the impulse response of any correction filter must be at least as long as the length of the impulse response to be corrected.
Generating the right golden calibration signal is just the first step for a successful calibration. Any calibration procedure requires a reference to be compared to as accurate as possible. A very important issue with AWG calibration is the need to characterize both amplitude and phase. This means that traditional spectrum analyzers cannot be used for proper calibration as they only provide magnitude information. Fortunately, modern high-bandwidth oscilloscopes come to the rescue. In the past, frequency response for oscilloscopes was purposely designed to be as close to gaussian as possible as this kind of response did not show any overshoot or ringing in its step response in the time-domain. Implementing such response in a high bandwidth real-time digital oscilloscope (RT-DSO) results in extremely high sampling rates to meet the Nyquist sampling criteria. A typical midrange 8GHz BW (20GSa/s) scope from a major manufacturer offers a +/- 1dB flatness and a 7o maximum deviation from a perfect linear phase response from DC up to 7.5GHz. Other higher-end products show even better amplitude flatness (0.5dB) and phase linearity responses over even higher bandwidths. This excellent flatness performance is obtained through internal corrections according to careful calibration in the factory using very well defined and characterized ultra-wideband pulse generation devices. In a typical calibration setup, the AWG to be calibrated along with all the signal transmission chains are connected to the oscilloscope either directly to the input or through a compatible high-impedance, high-bandwidth probe. Multiple AWG channels could be connected to different channels in the oscilloscope so simultaneous calibration of multiple channels could be performed. However, a better matched response among AWG channels will be obtained by sequentially performing the calibration procedure using the same scope channel. The process starts with the capture the time-domain waveform with the scope and performing an FFT with a convenient time-domain window (i.e. flattop). Then, reading the magnitude and phase values at the frequencies of the calibration tones and comparing those with known values for the ideal signal, will produce a series of magnitude/phase vs. frequency values. Scope must be triggered using the same sync output from the AWG regardless of the channel being calibrated. Doing these, any skew (differential delay) between channels will be embedded in the phase response so correction filters applied to the waveforms will automatically align all the signals in the time-domain (Figure 3.1).
The figure below depicts that the effects of quantization noise over the multi-tone calibration signal may be not negligible. In a) the calibration signal is generated by looping the basic multi-tone cycle. As the same samples repeat for every loop, so does the quantization noise. As a result, all the noise power goes to the exact location of the tones, interfering with them and causing amplitude and phase errors. In b) waveform length has been selected to accommodate three repetitions of the same basic waveform. However, if the waveform length is selected so it is not a multiple of three, the three occurrences of the basic signal will not be the same as the sampling times will fall in slightly different instants. The spectrum of the signal will still be the one corresponding to the original tones. However, quantization noise will be repeated with 1/3rd of the period so its spectrum will consists in three time the number of lines while the overall power will be the same, so the interfering components of the noise will have less power and accuracy for the calibration tones will improve. In order to get the best results, the number of repetitions and the waveform length do not have to share a divider other than 1. A good way to accomplish this is by selecting a prime number for the number of repetition and making sure the waveform length is not a multiple of it.
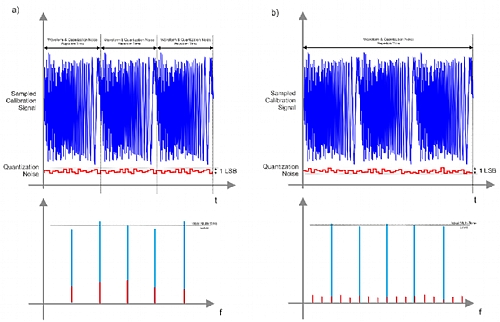
Figure 1.3 Effects of Quantization Noise Over the Multi-Tone Calibration Signal
The methodology described above works very well for wideband signals. However, for narrowband RF signals, the accuracy of the correction in terms of frequency resolution to reach a good modulation accuracy must be improved while the frequency response out of the band occupied by the signal is irrelevant. In this situation, an alternative calibration methodology based in adaptive equalization techniques can be used. The calibration signal may be any modulated carrier with a known modulation and a sufficient signaling speed to cover the full targeted band. The signal can be then captured by a scope or a VSA (Vector Signal Analyzer). A demodulation software executing an adaptive equalizer filter algorithm will obtain directly the complex correction baseband filter (Figure 3.4, top). This filter could be applied to the complex signal modulating the carrier for any modulation (the linear model is the same for every modulation).
The frequency response obtained during the calibration process can be used to calculate a correction filter using different time-domain or frequency-domain techniques. These filters should be applied to waveforms during the calculation process before being downloaded to the target AWG, or through a real-time FIR filter implemented in the target channel if the AWG hardware allows for it (Figure 3.4, bottom). The advantage of using real-time filters is that the waveform can be calculated independently of the target instrument and channel. Additionally, any change in the signal path modifying the frequency response only requires recalculating the filter taps once and not all the waveforms. For AWG incorporating DUC with IQ modulators, real-time corrections can be applied to the I/Q complex waveform at a much lower sampling rate or to the modulated waveform at the final sampling rate. Applying the correction to the complex I/Q baseband signal is a much better approach as the real-time DSP is performed at a lower speed and the number of taps required will be much reduced for the same level of correction accuracy (Figure 3.4).
Calibration should be performed for all the different DAC and output modes available in the AWG and at different sampling rates and amplitude levels. The overall frequency response of any DAC depends on the sampling rate as even ideal DACs show a sinc(f) response with a zero at the sampling rate (zeroth-order, or ZOH, response). A proper characterization of the frequency response of the system must subtract the influence of the ZOH at the calibration sampling rate and then apply the one corresponding to the actual sampling rate selected for the waveform before calculating the correction filter. However, some DACs incorporate an internal digital 1/sinc(f) digital filter so users must apply corrections based in the frequency response without having to correct for the ZOH response corresponding to the sample rate used in the calibration. Calibration procedures can be extended beyond the first Nyquist band. The images of the calibration signals at higher order bands can be used to calibrate the response of the generator for the generation of RF and mW modulated signals at those frequencies.
Figure below: VSAs (or DSO with VSA software) can be used to efficiently calibrate the response of an AWG (and any additional component) by directly generating a digitally modulated carrier (i.e. QPSK) with a high enough baud rate to cover all the band of interest. All the linear impairments in the system will influence the modulation quality in terms of the received constellation diagram and measured EVM. Advanced BSA software can identify the system response in order to apply aa adaptive equalizer correction (a complex FIR) to compensate for linear distortions. The frequency response (or the equalizer coefficients themselves) can be extracted so they can be applied to the signal being generated by the AWG. The corrected waveform will have a much higher accuracy than the original one and the usage of the equalizer will not improve any measurement in the VSA. Here, a 1.5GBaud QPSK signal is used to characterize over 1.5GHz of bandwidth around the carrier frequency. The overall EVM measurement for the uncorrected signal is around 5% while the EVM for the corrected signal is around 1%. In the Proteus platform, complex corrections can be applied in real-time to the baseband complex signal using a correction filter implemented in the FPGA. This methodology provides very good results for bandwidth-limited signals as frequency resolution may be very high.
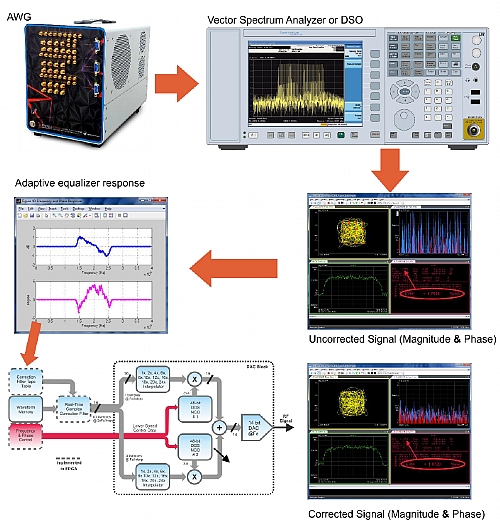
Figure 1.4 VSA Used to Calibrate AWG Response
Instrument calibration and waveform correction is part of the Proteus series solution. The WDS software (Figure 3.5) incorporates a tool to calibrate AWGs and associated components and calculate and apply correction filters for any Nyquist band. Frequency response for each channel is characterized in the factory and the corresponding correction factors can be read using SCPI commands and supplied in a CSV file. The WDS correction tool can combine the factory-supplied frequency response for the instrument with any combination of frequency response or correction factors from different sources and formats such as the Touchstone© S-parameter file format produced by almost any frequency or time domain VNA, or adaptive equalizer responses from VSAs. Once the frequency response is obtained, users can obtain a correction filter and analyze the corrected response. Users can specify the complexity (number of taps) of the filter and validate the accuracy of the correction within the same tool. Once the correction filter is designed, it can be applied to any real or complex (I/Q) waveform created within or imported by the WDS application. Corrected waveforms can be then downloaded to the target instrument and channel. The Proteus DAC incorporates a x/Sin(x) filter to compensate for the ZOH response. This means that there is no need to subtract the ZOH response from the frequency response data and add it again (at the same or a different sampling rate) before calculating the correction filter.
The figure below depicts how the WDS (Wave Design Studio) software is used as the SFP (Software Front Panel) of Proteus (or any other Tabor AWG). It can be also used (online and offline) as a powerful waveform edition and import tool (i.e. from MATLAB © or any DSO). Here, a Gaussian-envelope RF pulse have been designed using the formula editor. Time aligned marker (digital outputs) content has been also defined. The WDS tool can be also used to define complex sequences and triggering schemes. The same environment can also set up the digitizer and visualize any captured waveform as an oscilloscope. WDS can be extended by adding functional (Instrument calibration, correction) and application oriented (i.e. Radar or multi-tone) add-ons.
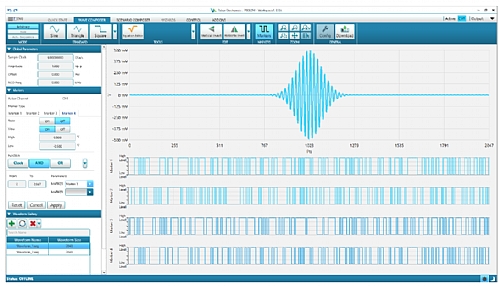
Figure 1.5 WDS Software Usage as a Software Front Panel for Proteus
The Proteus architecture allows for a different correction implementation, also supported by the WDS correction tool. It consists in implementing corrections through the application of a real-time FIR filter implemented in the FPGA block. Corrections can be applied to the waveform before being converted to analog (real-only taps), or to IQ waveform pair before being fed to the DUC (complex taps). The second choice is better for IQ modulated signals, especially for relatively narrowband signals as it requires much less taps to reach the same level of correction accuracy. FIR blocks can be activated and set up using SCPI commands or directly from the WDS environment (Figure 3.6, a & b).
The figure below depicts how corrections can be applied in real-time in the Proteus platform thanks to the DSP functionality implemented in the built-in FPGA. It can be applied to the AWG channels in both the direct (a) and the up-converted (b) modes an also in the digitizer channels in both the direct (c) and the down-converted (d) modes. The digitizer channels and any cabling and device attached to them can be easily calibrated once the AWG channels are calibrated and corrected. Once characterized, a correction filter can be calculated and applied.
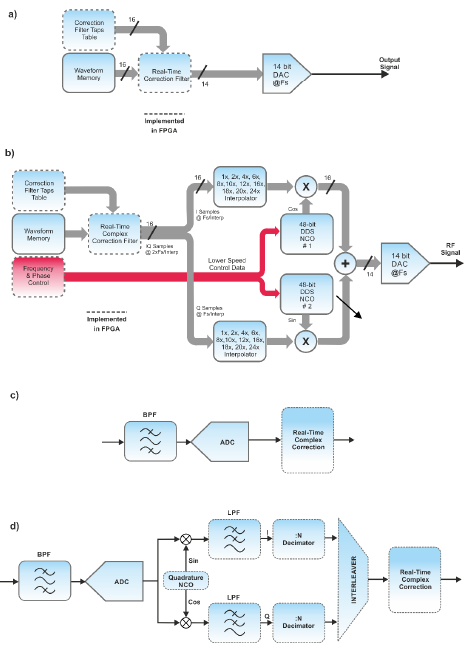
Figure 1.6 Real-time Signal Correction Block-Diagram
Calibration is another capability of the WDS application. Fully automated calibration is possible after defining the desired frequency range, operating mode and sampling rate. The calibration software supports a variety of high-BW, maximally flat frequency response oscilloscopes from manufacturers such as Keysight, Tektronix, LeCroy or R&S. The WDS also supports the generation of QPSK signals with known modulation characteristics (baseband filter, roll-off factor) at any symbol rate and carrier frequency so the right adaptive equalizer or channel model can be obtained by any VSA or scope equipped with VSA software.
Once the AWG section of the Proteus AWT have been properly calibrated, it can be used as the source of calibration signals for the Digitizer section. The WDS correction application also supports digitizer calibration and correction of the acquired waveforms for any of the Nyquist bands up to >7GHz. Again, the Proteus architecture allows for the implementation of the correction filters in real-time right after analog-to-digital conversion (real-only taps) or to the complex waveform (I/Q) after applying the DDC block, including decimation. This is also important as the digital trigger system can work directly over the corrected data so trigger events will be detected more accurately and consistently (Figure 3.6, c & d).
Part 4 - Real-Time Control Of Operating Quantum Computing Systems
For more information contact [email protected]